The post Bringing Percona Experts to a City Near You appeared first on MariaDB.org.
]]>The post Bringing Percona Experts to a City Near You appeared first on MariaDB.org.
]]>The post MariaDB Enterprise Server 10.6.17-13 maintenance release appeared first on MariaDB.org.
]]>The post MariaDB Enterprise Server 10.6.17-13 maintenance release appeared first on MariaDB.org.
]]>The post Bringing Percona Experts to a City Near You appeared first on MariaDB.org.
]]>The post Bringing Percona Experts to a City Near You appeared first on MariaDB.org.
]]>The post Short note re Progress and NuSphere appeared first on MariaDB.org.
]]>They own NuSphere which had a dispute with MySQL AB which was settled in 2002. My happy history as a MySQL employee biases me but I thought that NuSphere was not acting angelically.
I think it won’t happen.
The post Short note re Progress and NuSphere appeared first on MariaDB.org.
]]>The post Why MariaDB Is “Better” Than MySQL appeared first on MariaDB.org.
]]> Apples or oranges?Tea or coffee?Books or eBooks?Each of these comparisons has very similar features and serves many of the same purposes, but in the end, they are different choices people make. Do you know what else belongs on this list?MariaDB or MySQL?It’s time we discuss the age-old debate of MariaDB versus MySQL and see if […]
The post Why MariaDB Is “Better” Than MySQL appeared first on MariaDB.org.
]]>The post The Insert Benchmark: MariaDB, MySQL, small server, cached workload, some concurrency appeared first on MariaDB.org.
]]>This work was done by Small Datum LLC and sponsored by the MariaDB Foundation.
The workload here has some concurrency (4 clients) and the database is cached. The results might be different when the workload is IO-bound or has more concurrency. Results were recently shared for a workload with low concurrency (1 client),
The results here are similar to the results on the low-concurrency benchmark.
tl;dr
I started with the my.cnf.cz11a_bee config and then began to make small changes. For all configs I set these values to limit the size of the history list which also keeps the database from growing larger than expected. I rarely did this in the past.
innodb_max_purge_lag=500000innodb_max_purge_lag_delay=1000000
The post The Insert Benchmark: MariaDB, MySQL, small server, cached workload, some concurrency appeared first on MariaDB.org.
]]>The post Deploying Percona Everest on GCP with Kubectl for Windows 11 Users appeared first on MariaDB.org.
]]>The post Deploying Percona Everest on GCP with Kubectl for Windows 11 Users appeared first on MariaDB.org.
]]>The post Explain Hypothetical Scenario: The Application Rolls Back the Transaction in MySQL appeared first on MariaDB.org.
]]>When a transaction is initiated in MySQL using InnoDB, any changes made to the data during the transaction are logged in the transaction log. These changes could include updates, inserts, or deletes affecting table rows. However, these changes are not immediately made permanent in the database; instead, they exist in a tentative state where they can be committed or rolled back.
A rollback might be triggered by several scenarios:
ROLLBACK; command because it encountered an error or a specific condition that the application logic determines as requiring a reversal of the changes.When the rollback is triggered:
Transactions typically involve locking mechanisms to maintain isolation levels and prevent data anomalies. During a rollback:
In conclusion, a rollback is a vital feature of transactional databases like MySQL’s InnoDB, designed to ensure data integrity by enabling the database to revert to a consistent state in case of errors or specific conditions dictated by the application logic. Understanding the mechanics and implications of this process is crucial for database administration and application development.
What happens to uncommitted transactions in MySQL if the server crashes after the update?
The post Explain Hypothetical Scenario: The Application Rolls Back the Transaction in MySQL appeared first on The WebScale Database Infrastructure Operations Experts in PostgreSQL, MySQL, MariaDB and ClickHouse.
The post Explain Hypothetical Scenario: The Application Rolls Back the Transaction in MySQL appeared first on MariaDB.org.
]]>The post Changes to managing turbo boost in Ubuntu 22.04 and Linux 6.5 appeared first on MariaDB.org.
]]>I am far from an expert on this topic and what I write here might just be notes to myself. Be wary of following my advice.
Disabling turbo boost yesterday
I have been disabling turbo boost for many years on my home test servers to reduce performance variance from hardware, especially as the weather gets warm because I don’t have a server room with AC. The problem with turbo boost on some of my servers was cyclical behavior:
On my Intel servers I disable turbo boost via BIOS settings. On my AMD servers that used to be done via a script because I was using acpi-cpufreq: echo 0 > /sys/devices/system/cpu/cpufreq/boost
My goal is repeatable performance and I am willing to sacrifice peak HW performance to get that. Avoiding the cycle described above helps to achieve that. Alas this is a spectrum — I tolerate other things (CPU cache, database cache) that improve performance while adding variance. I assume that I want CPU frequency to stay within a narrow range. It isn’t clear that even when using acpi-cpufreq that I was getting a narrow range, but it did help.
From the Ryzen 7 7840HS CPU I am use on these servers the AMD specs state that the base speed is 3.8GHz and the max boost is up to 5.1GHz. With acpi-cpufreq the CPU cores can be in one of three frequency levels, and from cpupower frequency-info they are:
available frequency steps: 3.80 GHz, 2.20 GHz, 1.60 GHz
So even with turbo boost disabled (see the echo command above) there is still room for variance. But I don’t know enough to determine whether I need to do more tuning.
Disabling turbo boost today
After a recent update on Ubuntu 22.04 with HWE kernels I now run 6.5.0-27-generic and acpi-cpufreq has been replaced by amd-pstate. I am sure there are many benefits from this change, alas, it also brings complexity and confusion from users who now have server cooling problems (because things are running faster) and are trying to figure out how to fix them. Notes on setting up the server are here.
I noticed this change because with the the default (amd-pstate in active mode) this file doesn’t exist:
/sys/devices/system/cpu/cpufreq/boost
On a Ryzen 7 CPU I get the amd-pstate-epp driver in active mode. Output from /proc/cpuinfo and cpupower frequency-info from this state is below. Note that /sys/devices/system/cpu/cpufreq/boost doesn’t exist when in active mode. It does exist when in guided or passive mode. So I either need to switch to guided or passive mode or rollback to using the acpi-cpufreq driver. Which means I need to understand a bit more.
There is a lot of documentation for the amd-pstate driver. It isn’t meant for the casual user.
There is a big difference between acpi-cpufreq and amd-pstate and amd-pstate is the future but perhaps not today (for me). While with acpi-cpufreq and turbo boost disabled I should only get one of three CPU frequencies, I can get many more with amd-pstate. From cpupower frequency-info output
For now I will just rollback to using the acpi-cpufreq driver while figuring this out and possibly waiting for Linux 6.6 to show up on Ubuntu 22.04. I am not sure how mature amd-pstate is, and I won’t get support for cpupower set –turbo-boost 1 until 6.6 arrives.
I now have this in /etc/default/grub:
GRUB_CMDLINE_LINUX_DEFAULT=”pcie_aspm=off nosmt amd_pstate=disable”
CPU frequencies with acpi-cpufreq
This shows the CPU frequencies I get from an idle server with the acpi-cpufreq driver. Note that I mostly get only 3 values when boost is disabled (set to 0).
With /sys/devices/system/cpu/cpufreq/boost set to 0
With /sys/devices/system/cpu/cpufreq/boost set to 1
Appendix
Note that cpupower frequency-info only shows frequencies for one core, to see them all use cpupower -c all frequency-info.
Output from cpupower frequency-info with active mode
Output from cpupower frequency-info with guided mode
Output from cpupower frequency-info with passive mode
Output from /proc/cpuinfo
The post Changes to managing turbo boost in Ubuntu 22.04 and Linux 6.5 appeared first on MariaDB.org.
]]>The post How MariaDB and MySQL performance changed over releases appeared first on MariaDB.org.
]]>Continue reading “How MariaDB and MySQL performance changed over releases”
The post How MariaDB and MySQL performance changed over releases appeared first on MariaDB.org.
The post How MariaDB and MySQL performance changed over releases appeared first on MariaDB.org.
]]>The post Integrating Conflict-Free Replicated Data Types (CRDTs) with PostgreSQL for Distributed Systems appeared first on MariaDB.org.
]]>CRDTs are data types designed to simplify the development of resilient, scalable distributed systems. They allow multiple participants (nodes in a distributed system) to update data independently without central coordination, and then merge these updates in a way that resolves inconsistencies and conflicts predictably and automatically.
CRDTs typically come in two main types:
While PostgreSQL does not implement CRDTs within its internal mechanisms, understanding how to model data in ways compatible with CRDT principles can be beneficial, especially when using PostgreSQL as part of a distributed system. Here are some approaches and considerations for integrating CRDT concepts with PostgreSQL:
Although PostgreSQL does not natively support CRDTs, the principles underlying CRDTs can be applied through custom application logic or by integrating with specialized tools that support CRDTs. This approach allows PostgreSQL to be effectively used in distributed systems where data consistency and high availability are paramount. It’s important to carefully evaluate the trade-offs and ensure that the chosen approach aligns with the specific requirements of your distributed application or system.
Efficient Integration of PostgreSQL 16 with LDAP: Best Practices and Tips
The post Integrating Conflict-Free Replicated Data Types (CRDTs) with PostgreSQL for Distributed Systems appeared first on The WebScale Database Infrastructure Operations Experts in PostgreSQL, MySQL, MariaDB and ClickHouse.
The post Integrating Conflict-Free Replicated Data Types (CRDTs) with PostgreSQL for Distributed Systems appeared first on MariaDB.org.
]]>The post Release Roundup April 17, 2024 appeared first on MariaDB.org.
]]>The post Release Roundup April 17, 2024 appeared first on MariaDB.org.
]]>The post MariaDB Completes Nutanix Ready Certification for AI and Data-Driven Hybrid and Multicloud Applications appeared first on MariaDB.org.
]]>The post MariaDB Completes Nutanix Ready Certification for AI and Data-Driven Hybrid and Multicloud Applications appeared first on MariaDB.org.
]]>The post A Guide to Better Understanding MySQL Charset Levels appeared first on MariaDB.org.
]]> We usually receive and see some questions regarding the charset levels in MySQL, especially after the deprecation of utf8mb3 and the new default uf8mb4. If you understand how the charset works on MySQL but have some questions regarding this change, please check out Migrating to utf8mb4: Things to Consider by Sveta Smirnova.Some of the questions […]
The post A Guide to Better Understanding MySQL Charset Levels appeared first on MariaDB.org.
]]>The post MariaDB Contribution Statistics, April 2024 appeared first on MariaDB.org.
]]>Continue reading “MariaDB Contribution Statistics, April 2024”
The post MariaDB Contribution Statistics, April 2024 appeared first on MariaDB.org.
The post MariaDB Contribution Statistics, April 2024 appeared first on MariaDB.org.
]]>The post How do Bloom Indexes work in PostgreSQL? appeared first on MariaDB.org.
]]>Bloom indexes use a probabilistic data structure called a Bloom filter. Here’s how they function in PostgreSQL:
In PostgreSQL, you can create a Bloom index using the bloom access method, which needs to be installed from the bloomextension if not already available:
CREATE EXTENSION bloom;
To create a Bloom index on a table, specify the columns you want to include:
CREATE INDEX ON my_table USING bloom (column1, column2, column3);
You can also tune the Bloom index by setting parameters like the length of the bit array (length) and the number of hash functions (colwidth). These parameters balance between the space used by the index and the accuracy (likelihood of false positives).
Bloom indexes are a powerful feature in PostgreSQL for scenarios involving quick membership testing across multiple columns. They are particularly useful for large datasets where traditional indexing strategies would consume too much space or degrade performance. However, it’s essential to understand their probabilistic nature and plan for handling false positives in application logic.
RocksDB use case: Building ultra low-latency Mobile Advertising Network
How to identify strings that can be treated as numbers in PostgreSQL?
The post How do Bloom Indexes work in PostgreSQL? appeared first on The WebScale Database Infrastructure Operations Experts in PostgreSQL, MySQL, MariaDB and ClickHouse.
The post How do Bloom Indexes work in PostgreSQL? appeared first on MariaDB.org.
]]>The post Why SELECT COUNT(*) FROM TABLE Is Sometimes Very Slow in MySQL or MariaDB appeared first on MariaDB.org.
]]> If you have enough experience with MySQL, it is very possible that you stumbled upon an unusually slow SELECT COUNT(*) FROM TABLE; query execution, at least occasionally.Recently, I had a chance to investigate some of these cases closer, and it stunned me what huge differences there can be depending on the circumstance given the very […]
The post Why SELECT COUNT(*) FROM TABLE Is Sometimes Very Slow in MySQL or MariaDB appeared first on MariaDB.org.
]]>The post Comprehensive Guide to Aggregate Functions in PostgreSQL appeared first on MariaDB.org.
]]>COUNT(expression): Counts non-null values in a set.SUM(expression): Sums up the values of the expression.AVG(expression): Calculates the average of the expression values.MIN(expression): Finds the minimum value of the expression.MAX(expression): Finds the maximum value of the expression.STDDEV(expression): Computes the standard deviation of the input values.STDDEV_POP(expression): Computes the population standard deviation.STDDEV_SAMP(expression): Computes the sample standard deviation.VAR_POP(expression): Computes the population variance.VAR_SAMP(expression): Computes the sample variance.VARIANCE(expression): Alias for VAR_SAMP.COVAR_POP(expression1, expression2): Calculates the population covariance between two expressions.COVAR_SAMP(expression1, expression2): Calculates the sample covariance.CORR(expression1, expression2): Calculates the correlation coefficient.MODE(): Returns the mode of a set of values (the value that appears most frequently).PERCENTILE_CONT(fraction): Computes a percentile based on a continuous distribution of the column values.PERCENTILE_DISC(fraction): Computes a percentile based on a discrete distribution of the column values.RANK(expression)DENSE_RANK(expression)PERCENT_RANK(expression)CUME_DIST(expression)ARRAY_AGG(expression): Aggregates values, including nulls, into an array.STRING_AGG(expression, delimiter): Concatenates input values into a string, separated by a delimiter.JSON_AGG(expression): Aggregates values as a JSON array.JSONB_AGG(expression): Aggregates values as a JSONB array.JSON_OBJECT_AGG(key, value): Aggregates input as a JSON object.JSONB_OBJECT_AGG(key, value): Aggregates input as a JSONB object.XMLAGG(expression): Concatenates XML values.GROUPING(expression): Identifies the level of aggregation, particularly in GROUP BY GROUPING SETS.BIT_AND(expression): Performs a bitwise AND operation on all input values.BIT_OR(expression): Performs a bitwise OR operation on all input values.BOOL_AND(expression): Returns TRUE if all input values are TRUE.BOOL_OR(expression): Returns TRUE if at least one input value is TRUE.These aggregate functions are versatile tools for data analysis, allowing complex statistical, mathematical, and group-based operations to be performed directly within SQL queries, enhancing the analytical capabilities of PostgreSQL.
How to replace subqueries containing aggregate functions in PostgreSQL with Windows functions?
How to find outliers using the Median Absolute Deviation in PostgreSQL?
The post Comprehensive Guide to Aggregate Functions in PostgreSQL appeared first on The WebScale Database Infrastructure Operations Experts in PostgreSQL, MySQL, MariaDB and ClickHouse.
The post Comprehensive Guide to Aggregate Functions in PostgreSQL appeared first on MariaDB.org.
]]>The post Exploring PostgreSQL: How Tables are Stored and Indexed for Optimal Performance appeared first on MariaDB.org.
]]>PostgreSQL provides several index types, each suitable for different kinds of queries and data patterns:
In summary, PostgreSQL’s approach to table storage and indexing is designed to offer robust data handling capabilities tailored to a variety of data types and query needs. This flexibility ensures that PostgreSQL can be optimized for a wide array of applications, from simple web applications to complex analytical systems.
Tips and tricks to troubleshoot indexes with high maintenance costs in PostgreSQL
How to control automatic database maintenance operations in PostgreSQL 15?
The post Exploring PostgreSQL: How Tables are Stored and Indexed for Optimal Performance appeared first on The WebScale Database Infrastructure Operations Experts in PostgreSQL, MySQL, MariaDB and ClickHouse.
The post Exploring PostgreSQL: How Tables are Stored and Indexed for Optimal Performance appeared first on MariaDB.org.
]]>The post The Insert Benchmark: MariaDB, MySQL, small server, cached workload appeared first on MariaDB.org.
]]>This work was done by Small Datum LLC and sponsored by the MariaDB Foundation.
The workload here has low concurrency and the database is cached. The results might be different when the workload is IO-bound or has more concurrency.
tl;dr
I started with the my.cnf.cz11a_bee config and then began to make small changes. For all configs I set these values to limit the size of the history list which also keeps the database from growing larger than expected. I rarely did this in the past.
innodb_max_purge_lag=500000innodb_max_purge_lag_delay=1000000
The post The Insert Benchmark: MariaDB, MySQL, small server, cached workload appeared first on MariaDB.org.
]]>The post Understanding the Unnest Function in PostgreSQL: Transforming Arrays into Rows appeared first on MariaDB.org.
]]>unnest() function is a powerful tool that serves the purpose of expanding arrays into a set of rows, effectively transforming array elements into individual row entries in a result set. Conceptually, this is akin to “flattening” the array, where each element of the array is transformed from being a part of a collective array structure into a standalone row in the database output. This is particularly useful in scenarios where data stored as arrays needs to be manipulated or analyzed using standard SQL operations, which typically operate on row-based data.
The utility of unnest() extends beyond simple arrays to include scenarios involving multiple arrays or even arrays of composite types. When multiple arrays are unnested in parallel, each array is expanded simultaneously, with corresponding elements forming a row together. This allows for the alignment of related data from different arrays, which is especially useful in analyses involving multiple linked data points, such as time-series data or paired measurements.
Furthermore, unnest() can handle arrays containing composite types, thus enabling complex data structures stored within arrays to be decomposed into simpler, query-able rows. This capability is crucial when dealing with multidimensional data that has been compactly stored in PostgreSQL’s advanced data types. By leveraging unnest(), users can effectively bridge the gap between the non-relational nature of array data and the relational paradigm of SQL, enhancing both the flexibility and power of database operations in PostgreSQL.
To learn more about the PostgreSQL Unnest function, Please download the whitepaper here.
PostgreSQL 15 Data Types: Elevating Performance and Functionality
The post Understanding the Unnest Function in PostgreSQL: Transforming Arrays into Rows appeared first on The WebScale Database Infrastructure Operations Experts in PostgreSQL, MySQL, MariaDB and ClickHouse.
The post Understanding the Unnest Function in PostgreSQL: Transforming Arrays into Rows appeared first on MariaDB.org.
]]>The post How to query a REST API with MariaDB CONNECT engine appeared first on MariaDB.org.
]]>The most obvious use case is for data analysts, data scientists or product managers. Some of them can’t program at all, but chances are that they know SQL and use it in their job. So they can’t write a script to gather the data they need from an API. But if they can just run an SQL query, their problem is solved. In no time, without involving anyone else.
Now to data engineers, developers and DevOps. Sometimes applications read data from a remote API. This means that, for every used API, some developers will have to write some code. When a very similar result can be achieved by writing a CREATE TABLE statement, I call it a productivity problem.
Another problem is about optimising a process. The typical approach is that an application retrieves some data from an API call, transforms them, and writes them into a database. Many things can go wrong, corrupting data or preventing an update. The process might be too slow, because data have to travel twice and the application has to process them. And sending some types of data to/from the application might increase security risks if your data is sensitive.
MariaDB CONNECT allows us to interact with a huge variety of data sources. This includes other databases, data files in many formats, and REST APIs. Every time you send a SELECT to a CONNECT table backed by a REST API, data will be retrieved via HTTP or HTTPS, and will be presented to the client in the form of a normal resultset.
This is obviously slower than querying local data. And it’s theoretically slower than querying an API directly from an application. But often the purpose is to populate a table with remote data. This table can be a regular InnoDB table, which will answer queries quickly. And the application can launch an ALTER TABLE ... ENGINE or INSERT ... SELECT query to move the data directly from the remote API to the local database. This will be showed later in this article.
There are also cases when the performance difference doesn’t matter. In the case of a data analyst, it should be ok to wait for more time to run a query, as long as running a query is all they need to do to read data from the API.
Let’s use progressively more complex examples so explore interesting CONNECT features.
The examples are based on the Hashicorp Release API, that can be used to find out whether HashiCorp software needs to be upgraded.
Let’s start by creating a table that contains very simple results from a REST API call. It returns an array of strings. In MariaDB, we’ll want to see it as a one-column table, where each string is a row.
CREATE OR REPLACE TABLE hashicorp_product (
    name VARCHAR(100) NOT NULL
)
    ENGINE = CONNECT,
    TABLE_TYPE = JSON,
    HTTP = 'https://api.releases.hashicorp.com/v1/products'
;ENGINE: We’re specifying that the table must use the CONNECT engine, rather than the default engine (normally InnoDB).TABLE_TYPE: CONNECT can handle a big range of data sources and formats, so we need to specify which one needs to be used in this case: JSON.HTTP: For JSON tables, we can specify a URL. An HTTP call with the GET method, is expected to return the data we want to query. HTTPS is supported, as showed in the example below. Querystrings are not used in our examples, but they are supported, too.The most common case is REST APIs returning an array of objects. In MariaDB, we want to see every object as a row.
Objects are key/value data structures where each property is a column. Therefore CONNECT is able to create a table even if we don’t specify the columns we want! Each property name will be used as a column name, and it will infer the right types to use. This functionality is called table discovery, and there some other storage engines are able to use it, too.
CREATE OR REPLACE TABLE consul_release
    ENGINE = CONNECT,
    TABLE_TYPE = JSON,
    HTTP = 'https://api.releases.hashicorp.com/v1/releases/consul'
;
Now, let’s see the resulting table structure:
> SHOW CREATE TABLE consul_release G
*************************** 1. row ***************************
       Table: consul_release
Create Table: CREATE TABLE `consul_release` (
  `builds_arch` char(5) NOT NULL `JPATH`='$.builds[0].arch',
  `builds_os` char(6) NOT NULL `JPATH`='$.builds[0].os',
  `builds_url` char(100) NOT NULL `JPATH`='$.builds[0].url',
  `is_prerelease` tinyint(1) NOT NULL `JPATH`='$.is_prerelease',
  `license_class` char(10) NOT NULL `JPATH`='$.license_class',
  `name` char(6) NOT NULL `JPATH`='$.name',
  `status_state` char(9) NOT NULL `JPATH`='$.status.state',
  `status_timestamp_updated` char(24) NOT NULL `JPATH`='$.status.timestamp_updated',
  `timestamp_created` char(24) NOT NULL `JPATH`='$.timestamp_created',
  `timestamp_updated` char(24) NOT NULL `JPATH`='$.timestamp_updated',
  `url_changelog` char(79) NOT NULL `JPATH`='$.url_changelog',
  `url_docker_registry_dockerhub` char(52) NOT NULL `JPATH`='$.url_docker_registry_dockerhub',
  `url_docker_registry_ecr` char(51) NOT NULL `JPATH`='$.url_docker_registry_ecr',
  `url_license` char(53) NOT NULL `JPATH`='$.url_license',
  `url_project_website` char(37) NOT NULL `JPATH`='$.url_project_website',
  `url_release_notes` char(40) NOT NULL `JPATH`='$.url_release_notes',
  `url_shasums` char(95) NOT NULL `JPATH`='$.url_shasums',
  `url_shasums_signatures` char(99) NOT NULL `JPATH`='$.url_shasums_signatures[0]',
  `url_source_repository` char(35) DEFAULT NULL `JPATH`='$.url_source_repository',
  `version` char(19) NOT NULL `JPATH`='$.version'
) ENGINE=CONNECT DEFAULT CHARSET=utf8mb4 COLLATE=utf8mb4_uca1400_ai_ci `TABLE_TYPE`='JSON' `HTTP`='https://api.releases.hashicorp.com/v1/releases/consul'
Interesting, isn’t it? Let’s look at the first column, as an example:
`builds_arch` char(5) NOT NULL `JPATH`='$.builds[0].arch',We can see that every row-object contains a nested array called builds that contains objects with these properties: arch, os, url. By default, the related columns are colled builds_arch, builds_os and builds_url, and they contain the values from the first element of the builds array.
CONNECT uses a purpose-built language called JPath to specify this. If you know JSONPath you won’t find JPATH hard to understand.
Let’s use the above example again. But suppose that the table we want to build is different from the one created by default by MariaDB. We can run a statement like this:
CREATE OR REPLACE TABLE consul_release (
    version VARCHAR(100) NOT NULL,
    not_stable VARCHAR(100) NOT NULL
        FIELD_FORMAT = 'is_prerelease',
    state VARCHAR(100) NOT NULL
        FIELD_FORMAT = 'status.state',
    timestamp_created TIMESTAMP NOT NULL
)
    ENGINE = CONNECT,
    TABLE_TYPE = JSON,
    HTTP = 'https://api.releases.hashicorp.com/v1/releases/consul'
;
Now, here’s what we did:
version and timestamp_created columns have the same name as the matching properties. So there is no need to specify where these values should come from.not_stable column has the same value as the is_prerelease property, that is not nested.state property, nested in an object property called status.Let’s query the table:
> SELECT * FROM consul_release;
+---------------------+------------+-----------+---------------------+
| version             | not_stable | state     | timestamp_created   |
+---------------------+------------+-----------+---------------------+
| 1.16.5+ent.fips1402 | false      | supported | 2024-01-23 20:40:10 |
| 1.16.5+ent          | false      | supported | 2024-01-23 20:40:05 |
| 1.16.5              | false      | supported | 2024-01-23 20:31:17 |
| 1.15.9+ent          | false      | supported | 2024-01-23 20:28:28 |
| 1.17.2+ent.fips1402 | false      | supported | 2024-01-23 20:26:59 |
| 1.17.2+ent          | false      | supported | 2024-01-23 20:26:53 |
| 1.15.9              | false      | supported | 2024-01-23 20:23:38 |
| 1.17.2              | false      | supported | 2024-01-23 20:23:21 |
| 1.17.1+ent.fips1402 | false      | supported | 2023-12-14 23:16:04 |
| 1.17.1+ent          | false      | supported | 2023-12-14 23:15:57 |
+---------------------+------------+-----------+---------------------+
Note that only one status nested object exists (it’s not in an array).
Now let’s discuss a different case. As mentioned before, the builds property is an array. So, for every table row, an array exists with multiple values.
Suppose we want to expand it, and change the logic: we want to have a row for each builds element. Values that are outside that array will be repeated multiple times.
CREATE OR REPLACE TABLE consul_build (
    version VARCHAR(100) NOT NULL,
    arch VARCHAR(100) NOT NULL
        FIELD_FORMAT = 'builds.[*].arch',
    os VARCHAR(100) NOT NULL
        FIELD_FORMAT = 'builds[*].os',
    timestamp_created TIMESTAMP NOT NULL
)
    ENGINE = CONNECT,
    TABLE_TYPE = JSON,
    HTTP = 'https://api.releases.hashicorp.com/v1/releases/consul'
;
As you can see, we specified builds.[*].arch. This is a JPATH syntax which wouldn’t work in JSONPath. And it means that the builds array must be expanded. Here’s a query example:
> SELECT * FROM consul_build
  ORDER BY LEFT(version, 6) DESC
  FETCH FIRST 10 ROWS WITH TIES;
+---------------------+-------+---------+---------------------+
| version             | arch  | os      | timestamp_created   |
+---------------------+-------+---------+---------------------+
| 1.17.2+ent.fips1402 | amd64 | linux   | 2024-01-23 20:26:59 |
| 1.17.2+ent.fips1402 | arm64 | linux   | 2024-01-23 20:26:59 |
| 1.17.2+ent.fips1402 | amd64 | windows | 2024-01-23 20:26:59 |
| 1.17.2+ent          | amd64 | darwin  | 2024-01-23 20:26:53 |
| 1.17.2+ent          | arm64 | darwin  | 2024-01-23 20:26:53 |
| 1.17.2+ent          | 386   | freebsd | 2024-01-23 20:26:53 |
| 1.17.2+ent          | amd64 | freebsd | 2024-01-23 20:26:53 |
| 1.17.2+ent          | 386   | linux   | 2024-01-23 20:26:53 |
| 1.17.2+ent          | amd64 | linux   | 2024-01-23 20:26:53 |
| 1.17.2+ent          | arm   | linux   | 2024-01-23 20:26:53 |
| 1.17.2+ent          | arm64 | linux   | 2024-01-23 20:26:53 |
| 1.17.2+ent          | s390x | linux   | 2024-01-23 20:26:53 |
| 1.17.2+ent          | amd64 | solaris | 2024-01-23 20:26:53 |
| 1.17.2+ent          | 386   | windows | 2024-01-23 20:26:53 |
| 1.17.2+ent          | amd64 | windows | 2024-01-23 20:26:53 |
| 1.17.2              | amd64 | darwin  | 2024-01-23 20:23:21 |
| 1.17.2              | arm64 | darwin  | 2024-01-23 20:23:21 |
| 1.17.2              | 386   | freebsd | 2024-01-23 20:23:21 |
| 1.17.2              | amd64 | freebsd | 2024-01-23 20:23:21 |
| 1.17.2              | 386   | linux   | 2024-01-23 20:23:21 |
| 1.17.2              | amd64 | linux   | 2024-01-23 20:23:21 |
| 1.17.2              | arm   | linux   | 2024-01-23 20:23:21 |
| 1.17.2              | arm64 | linux   | 2024-01-23 20:23:21 |
| 1.17.2              | amd64 | solaris | 2024-01-23 20:23:21 |
| 1.17.2              | 386   | windows | 2024-01-23 20:23:21 |
| 1.17.2              | amd64 | windows | 2024-01-23 20:23:21 |
+---------------------+-------+---------+---------------------+
If you don’t understand the WITH TIES syntax, see MariaDB: WITH TIES syntax.
As you can see, a row was returned for every element of builds. Builds of the same release share the same values for version and timestamp_created.
Sometimes the values returned by a remote API are not convenient for our applications. In this case, we may want to process and transform some values. This is something we can do with some MariaDB features that are not specific to CONNECT.
Let’s see an example first:
CREATE OR REPLACE TABLE consul_release (
    version VARCHAR(100) NOT NULL,
    state VARCHAR(100) NOT NULL
        FIELD_FORMAT = 'status.state',
    is_prerelease BOOL NOT NULL DEFAULT 0 INVISIBLE,
    is_stable BOOL GENERATED ALWAYS AS (NOT is_prerelease) VIRTUAL,
    timestamp_created TIMESTAMP NOT NULL
)
    ENGINE = CONNECT,
    TABLE_TYPE = JSON,
    HTTP = 'https://api.releases.hashicorp.com/v1/releases/consul'
;
is_prerelease is the column that contains the original value returned by the API. It is defined as an invisible column.is_prerelase has a default value. This is required for invisible columns, but it has no effect for CONNECT JSON tables.is_stable is a generated column, which contains the result off an expression (NOT is_prerelease).SELECT * FROM consul_release will return the is_stable column, but not the is_prerelease column. It will still be possible to require this column explicitly by running:
SELECT *, is_prerelease FROM conssul_release;Many REST APIs have two types of GET methods:
Above we used two methods of the first type. Now we’re approaching a method of the second type.
And we have a problem: we have a single parametrised URL to call for any object we want to see. But for CONNECT there’s no such thing as parameters in URLs, so every API call should be handled by a different table. And we don’t want to have a CONNECT table for every release of every HashiCorp product.
What can we do about it? Well, at a low level we’ll actually have those tables. But we can hide the mechanism that creates and queries the table inside a stored procedure.
DELIMITER ||
CREATE OR REPLACE PROCEDURE select_consul_release(IN i_release VARCHAR(100))
    NOT DETERMINISTIC
    MODIFIES SQL DATA
BEGIN
    DECLARE v_sql TEXT;
    DECLARE v_table_name VARCHAR(64) DEFAULT CONCAT('consul_release_', CONNECTION_ID());
    SET v_sql := SFORMAT('
    CREATE OR REPLACE TABLE {} (
        version VARCHAR(100) NOT NULL,
        state VARCHAR(100) NOT NULL
            FIELD_FORMAT = ''status.state'',
        is_prerelease BOOL NOT NULL DEFAULT 0 INVISIBLE,
        is_stable BOOL GENERATED ALWAYS AS (NOT is_prerelease) VIRTUAL,
        timestamp_created TIMESTAMP NOT NULL
    )
        ENGINE = CONNECT,
        TABLE_TYPE = JSON,
        HTTP = ''https://api.releases.hashicorp.com/v1/releases/consul/{}''
    ;
    ', v_table_name, i_release);
    EXECUTE IMMEDIATE v_sql;

    EXECUTE IMMEDIATE CONCAT('SELECT * FROM ', v_table_name, ';');
    EXECUTE IMMEDIATE CONCAT('DROP TABLE ', v_table_name, ';');
END;
||
DELIMITER ;
This procedure creates a CONNECT table from a REST URL that contains the desired argument (the release name). Then it runs a SELECT to return its contents, and destroys the table. If multiple connections are likely to use this procedure concurrently, they won’t interfere with each other because the table name contains the current connection id.
Alternatively, you might want multiple connections to share existing CONNECT tables. To do so, use CREATE TABLE IF NOT EXISTS (rather than OR REPLACE) and use the release name as part of the table name (rather than the connection id).
Proof that it works:
> CALL select_consul_release('1.17.2');
+---------+-----------+-----------+---------------------+
| version | state     | is_stable | timestamp_created   |
+---------+-----------+-----------+---------------------+
| 1.17.2  | supported |         1 | 2024-01-23 20:23:21 |
+---------+-----------+-----------+---------------------+
These procedures won’t work in MySQL because they use the unique MariaDB features:
CREATE OR REPLACE TABLE, which is similar to DROP TABLE + CREATE TABLE, but it’s atomic and less verbose;SFORMAT(), to compose strings by interpolation (see How to compose strings in MariaDB);EXECUTE IMMEDIATE, which has some limitations but can normally be used as a shortcut for PREPARE + EXECUTE + DEALLOCATE PREPARE.We mentioned before that a CONNECT table can be materialised. This means that it becomes a regular table, which normally uses the InnoDB storage engine, and the remote data is written to the local database.
The simplest and fastest way to materialise a CONNECT table is the following:
ALTER TABLE table_name ENGINE = InnoDB;
RENAME TABLE table_name TO new_name;
I don’t like to give numbers that might depend on a lot of factors, but in most cases it will take less than 5 seconds even for tables that contain a few millions of rows.
Your logic might be more complex than this. Maybe you want to incrementally import data from a remote API every night. This means that you can’t create a new table every time.
The first time you import data you will need to create the table with the current data. You can use the method I have shown above, for a one off materialisation.
Incremental imports can be done in this way:
INSERT INTO materialised_table
    (column1, column2, column3)
    SELECT column1, column2, column3 FROM connect_table
;I left this method as the last one because it’s rarely useful. But you might want to know about it if you need a JSON file, and anyway it tells us something about how CONNECT works internally.
You might have noticed that all the above CONNECT tables use the JSON TABLE_TYPE. This table type was originally designed to use JSON files as relational tables. To do this, one has to specify a file name:
CREATE TABLE table_name
...
ENGINE = CONNECT,
TABLE_TYPE = JSON,
FILE_NAME = 'filename.json';
If the file exists in the data directory, it will be used. If not, it will be created.
But even if we didn’t specify a file name, one was created anyway. If you ran the CREATE TABLEs above, you probably noticed warnings like this:
*************************** 1. row ***************************
  Level: Warning
   Code: 1105
Message: No file name. Table will use hashicorp_product.json
And if you look in the data directory, in the database subdirectory, we’ll see this:
# ls -l /var/lib/mysql/test/hashicorp_product.*
-rw-rw---- 1 mysql mysql 907 Jan 27 14:23 /var/lib/mysql/test/hashicorp_product.frm
-rw-rw---- 1 mysql mysql   0 Jan 27 14:23 /var/lib/mysql/test/hashicorp_product.json
Initially the file is empty. After we run a query, it fill be filled with the output received from the REST API, regardless any WHERE in our query:
# cat hashicorp_product.json
["athena-cli","atlas-upload-cli",...]
So when we query a CONNECT JSON table, CONNECT will check the HTTP table option. If it was specified, CONNECT will call that URL and populate (or overwrite) the JSON file. The rest of the operations are performed as if it was a regular file-based CONNECT table.
CONNECT JSON tables have some important limitations:
Autorization HTTP header). But these features are independent: tokens are not always passed in an HTTP header, and HTTP headers have other uses too.SHOW CREATE TABLE command or by querying the information_schema.TABLES table.Some of these limitations can be removed or lifted by implementing the necessary features as stored procedures. I will demonstrate this in a future article.
The CONNECT storage engine allows easy data integration between MariaDB and other technologies. In this article we saw how to use CONNECT to query a REST API. We discussed several examples, progressively more complex, which covers the majority of the problems that you might have when working with CONNECT and a REST API.
Should you have questions, or problems with CONNECT, don’t hesitate to contact us for a consultation.
Federico Razzoli
The post How to query a REST API with MariaDB CONNECT engine appeared first on MariaDB.org.
]]>The post Partially Rolling Back a Transaction in MySQL or PostgreSQL appeared first on MariaDB.org.
]]> This short write-up focuses on a different transaction control behavior of databases. Though this is not unusual, I decided to write an article on rolling back transactions to a particular point. I selected this topic because I found many people are not aware of this feature in databases.DescriptionEvery ACID-compliant RDBMS follows the “All or None” […]
The post Partially Rolling Back a Transaction in MySQL or PostgreSQL appeared first on MariaDB.org.
]]>The post Sysbench on a (less) small server: MariaDB and MySQL appeared first on MariaDB.org.
]]>This work was done by Small Datum LLC and sponsored by the MariaDB Foundation. A previous post shared results from my smallest and oldest server. This has results from two newer and faster, but still small, servers. Regardless, the results don’t change.
My standard disclaimer is that sysbench with low-concurrency is great for spotting CPU regressions. However, a result with higher concurrency from a larger server is also needed to understand things. Results from IO-bound workloads and less synthetic workloads are also needed. But low-concurrency, cached sysbench is a great place to start.
tl;dr
For MySQL I used 5.6.51, 5.7.44 and 8.0.36.
The first GA release for MariaDB 10.2 was in 2017. The first GA release for MySQL 5.6 was in 2013. So while I cannot claim that my testing covers MySQL and MariaDB from the same time period, I can claim that I am testing old versions of both.
Everything was compiled from source with similar CMake command lines and CMAKE_BUILD_TYPE set to Release. It is much easier to compile older MariaDB releases than older MySQL releases. For MariaDB I did not have to edit any source files. Notes on compiling MySQL are here for 5.6, for 5.6 and 5.7, for 5.7 and for 8.0. A note on using cmake is here.

.png)

.png)

.png)

.png)

.png)

.png)

.png)
.png)


.png)

.png)

.png)

.png)

.png)

.png)

.png)
This post is already too long so I won’t provide charts but the raw data is here for ser4 and for ser7.
What might be the source of the reads? My first guess is read-modify-write (RMW) from the InnoDB redo log. The problem is that the redo log uses buffered IO (not O_DIRECT), redo log writes are done as a multiple of 512 bytes and writing to the first 512 bytes of a 4kb filesystem page will do a storage read if that 4kb page isn’t in the OS page cache. Note that innodb_log_write_ahead_size in MySQL 8 reduces the chance of this happening. It was my first guess because we suffered from it long ago with web-scale MySQL.
I ran additional tests where the InnoDB redo log and InnoDB data files use different storage devices I see that all of the read IO occurs on the storage device for the redo log so my guess was correct but why this occurs for modern MariaDB but not for MySQL remains a mystery.
The data from the tables below is here for ser4 and for ser7.
The post Sysbench on a (less) small server: MariaDB and MySQL appeared first on MariaDB.org.
]]>The post Impact of Fragmented PostgreSQL Infrastructure on Performance, Scalability, and Security appeared first on MariaDB.org.
]]>Impact: Fragmented data can lead to inefficient use of storage and slow query performance. When data is not contiguous, more disk I/O is required to retrieve the same amount of data, which slows down read and write operations. On an infrastructure level, inconsistent configurations across database nodes (in a cluster environment) can lead to uneven load distribution and inefficient resource utilization.
Mitigation:
VACUUM and REINDEX can help in managing data fragmentation.Impact: Fragmented infrastructure can hinder scalability due to the complexities of adding new nodes or resources that need to integrate with an inconsistent environment. Scaling out (adding more nodes) or scaling up (adding resources to existing nodes) can be problematic if each part of the infrastructure does not adhere to a common standard or practice.
Mitigation:
Impact: A fragmented approach to high availability, where different nodes or clusters have varied failover mechanisms or replication strategies, can lead to increased downtime and data loss during failures. Discrepancies in replication setups or failover protocols can cause delays in recovery or failovers that do not operate as expected.
Mitigation:
Impact: Inconsistent configurations and patch levels across database components can lead to unpredictable behavior and system crashes, reducing the overall reliability of the system. Fragmented maintenance and backup strategies can also lead to data inconsistencies and restoration issues.
Mitigation:
Impact: A fragmented security setup, where different parts of the database follow different security protocols, can create vulnerabilities. Inconsistent application of security updates, configurations, and access controls can lead to breaches and data leaks.
Mitigation:
Fragmentation in PostgreSQL infrastructure can lead to serious challenges across several critical aspects of database management. Addressing these issues requires a strategic approach focusing on standardization, automation, and regular maintenance. By mitigating fragmentation, organizations can enhance their database systems’ efficiency, reliability, and security, ensuring that they are robust and scalable enough to meet current and future demands.
The post Impact of Fragmented PostgreSQL Infrastructure on Performance, Scalability, and Security appeared first on The WebScale Database Infrastructure Operations Experts in PostgreSQL, MySQL, MariaDB and ClickHouse.
The post Impact of Fragmented PostgreSQL Infrastructure on Performance, Scalability, and Security appeared first on MariaDB.org.
]]>The post Evaluating the Impact of Missing Statistics on PostgreSQL Query Performance appeared first on MariaDB.org.
]]>ANALYZE command to choose the most efficient query execution plan. Missing or outdated statistics can lead to poor decisions, such as choosing a sequential scan over an index scan or misestimating the number of rows a query operation might return.
To empirically compare PostgreSQL performance with and without up-to-date statistics, you can conduct a controlled test:
ANALYZE on your database to ensure statistics are current.ALTER TABLE table_name ALTER COLUMN column_name SET STATISTICS -1; on several tables and columns to invalidate statistics. Be cautious with this step, as it affects query planning.ANALYZE on the entire database or affected tables to restore statistics.While conducting such a test, you’ll likely observe a degradation in query performance when PostgreSQL operates with missing or outdated statistics. This experiment reinforces the importance of maintaining accurate statistics for optimal database performance. Regularly monitoring statistics health and configuring autovacuum and analyze settings appropriately are key practices for sustaining high performance in PostgreSQL databases.
Preventing Broken Foreign Keys in PostgreSQL: Causes and Solutions
How to define and capture Baselines in PostgreSQL Performance Troubleshooting?
Optimizing Query Performance in PostgreSQL 16 with the Advanced auto_explain Extension
The post Evaluating the Impact of Missing Statistics on PostgreSQL Query Performance appeared first on The WebScale Database Infrastructure Operations Experts in PostgreSQL, MySQL, MariaDB and ClickHouse.
The post Evaluating the Impact of Missing Statistics on PostgreSQL Query Performance appeared first on MariaDB.org.
]]>The post Optimizing Query Performance: Troubleshooting and Resolving Outdated Statistics in PostgreSQL appeared first on MariaDB.org.
]]>ANALYZE command (either manually or automatically by the autovacuum daemon) to make informed decisions about query plans. Here’s how to troubleshoot and resolve issues related to outdated statistics:
pg_stat_all_tables view to check the last time tables were analyzed. If the last_analyze timestamp is significantly old, the statistics may be outdated.
SELECT relname, last_analyze
FROM pg_stat_all_tables
WHERE schemaname = 'public';
If you identify tables with outdated statistics, manually run the ANALYZE command to update the statistics:
ANALYZE verbose tablename;
Use ANALYZE verbose to analyze all tables and to receive detailed output. Omit tablename to analyze the entire database.
Ensure that the autovacuum daemon is properly configured to automatically analyze tables:
postgresql.conf for settings like autovacuum, autovacuum_analyze_threshold, and autovacuum_analyze_scale_factor.
autovacuum = on
autovacuum_analyze_threshold = 50
autovacuum_analyze_scale_factor = 0.1
autovacuum_analyze_scale_factor can make autovacuum run analyze more frequently.log_autovacuum_min_duration setting in postgresql.conf to log autovacuum and autoanalyze operations taking longer than a specified duration.
log_autovacuum_min_duration = '0s' -- Logs all autovacuum activities
pg_stat_statements: This extension provides insights into execution statistics of all SQL statements executed by the server, helping identify queries that may suffer from outdated statistics.
CREATE EXTENSION IF NOT EXISTS pg_stat_statements;
pg_stat_statements to identify queries with poor performance, which might benefit from updated statistics.Maintaining up-to-date statistics is crucial for optimal query planning and overall database performance. Regular monitoring and appropriate configuration of PostgreSQL’s analyze functions can help ensure that your database statistics remain current, preventing performance degradation due to outdated statistics.
Optimizing PostgreSQL: A Guide to Troubleshooting Long-Running Queries and Wait Events
Implementing the Materialized Path Model in PostgreSQL: A Step-by-Step Guide
Mastering Row Locks in PostgreSQL: Ensuring Data Integrity and Performance
The post Optimizing Query Performance: Troubleshooting and Resolving Outdated Statistics in PostgreSQL appeared first on The WebScale Database Infrastructure Operations Experts in PostgreSQL, MySQL, MariaDB and ClickHouse.
The post Optimizing Query Performance: Troubleshooting and Resolving Outdated Statistics in PostgreSQL appeared first on MariaDB.org.
]]>The post How to Replicate and Rename a Database in MariaDB appeared first on MariaDB.org.
]]> MySQL/MariaDB replication filter is an important feature when we need to replicate only certain databases or tables. Having this configuration option change dynamically is really convenient, but in this article, we’ll note that some replication filters are not dynamic, and you should be aware of that.The use case here is to replicate one database from […]
The post How to Replicate and Rename a Database in MariaDB appeared first on MariaDB.org.
]]>And if you think this post is not
The post 17 Years of Insecure MySQL Client ! appeared first on MariaDB.org.
]]>And if you think this post is not
The post 17 Years of Insecure MySQL Client ! appeared first on MariaDB.org.
]]>The post Ask Me Anything About MySQL 5.7 to 8.0 Post EOL appeared first on MariaDB.org.
]]> We met with Vinicius Grippa, a Senior Support Engineer at Percona. He is also active in the open source community and was recognized as a MySQL Rock Star in 2023.In the previous interview with Vinicius, we discussed the upcoming End of Life (EOL) for MySQL 5.7. Now that MySQL 5.7 has reached EOL, MySQL 8 […]
The post Ask Me Anything About MySQL 5.7 to 8.0 Post EOL appeared first on MariaDB.org.
]]>The post Why Top Spanish Business School Esade Migrated from MySQL to MariaDB Enterprise Server appeared first on MariaDB.org.
]]>The post Why Top Spanish Business School Esade Migrated from MySQL to MariaDB Enterprise Server appeared first on MariaDB.org.
]]>The post MariaDB Joins Forces with Google Cloud to Enhance Support Operations on Google Distributed Cloud appeared first on MariaDB.org.
]]>The post MariaDB Joins Forces with Google Cloud to Enhance Support Operations on Google Distributed Cloud appeared first on MariaDB.org.
]]>Parallel replication is deactivated by default:
SQL > SHOW GLOBAL VARIABLES LIKE \'%parallel%\';
+-------------------------------+------------+
| Variable_name | Value |
+-------------------------------+------------+
| slave_domain_parallel_threads | 0 |
| slave_parallel_max_queued | 131072 |
| slave_parallel_mode | optimistic |
| slave_parallel_threads | 0 |
| slave_parallel_workers | 0 |
+-------------------------------+------------+
Parallel replication is activated by setting the server variables slave_parallel_threads:
SQL > SET GLOBAL slave_parallel_threads = 8;
ERROR 1198 (HY000): This operation cannot be performed as you have a running slave \'\'; run STOP SLAVE \'\' first
However, this must be done when replication is stopped:
SQL > STOP SLAVE;
SQL > SET GLOBAL slave_parallel_threads = 8;
SQL > START SLAVE;
Replication then caught up a little faster. However, as we were impatient, we tried to make it even faster. With the command:
SQL > SHOW SLAVE STATUSG
...
Slave_SQL_Running_State: Waiting for room in worker thread event queue
...
we found the following message. You would also see it using the SHOW PROCESSLIST command:
SQL > SHOW PROCESSLIST;
+--------+-------------+- ... -+-----------+------+-----------------------------------------------+- ... -+
| Id | User | ... | Command | Time | State | ... |
+--------+-------------+- ... -+-----------+------+-----------------------------------------------+- ... -+
... ... ...
| 212496 | system user | ... | Slave_SQL | 16 | Waiting for room in worker thread event queue | ... |
+--------+-------------+- ... -+-----------+------+-----------------------------------------------+- ... -+
According to the documentation, it can help in this case to increase the size of the slave_parallel_max_queued variable slightly (attention: Oom!).
SQL > STOP SLAVE;
SQL > SET GLOBAL slave_parallel_max_queued = 1*1024*1024;
SQL > SHOW GLOBAL VARIABLES LIKE \'%parallel%\';
+-------------------------------+------------+
| Variable_name | Value |
+-------------------------------+------------+
| slave_domain_parallel_threads | 0 |
| slave_parallel_max_queued | 1048576 |
| slave_parallel_mode | optimistic |
| slave_parallel_threads | 8 |
| slave_parallel_workers | 8 |
+-------------------------------+------------+
SQL > START SLAVE;
We have played around with the values slave_parallel_threads in the range from 4 to 32 (with 8 vCores) and with slave_parallel_max_queued in the range from 128 kbyte to 32 Mbyte.
Caution: Do not exaggerate: 32 threads x 32 Mbyte = 1 Gbyte RAM (Oom)!
To find out which values are the optimum, you would have to test and measure more extensively. In any case, the replication made up the 5-day backlog after about an hour, towards the end a little more than at the beginning, which was hopefully caused by our configuration adjustments.
Depending on what DML statements are currently running, you can see that all threads can be used or that some threads have to wait for other threads:
SQL > SHOW PROCESSLIST;
+--------+-----------------+--------------+--------+---------------------------------------------------------------+------------+
| Id | User | Command | Time | State | Info |
+--------+-----------------+--------------+--------+---------------------------------------------------------------+------------+
| 2 | event_scheduler | Daemon | 506179 | Waiting for next activation | NULL |
| 191154 | root | Query | 0 | starting | show pr... |
| 208669 | replication | Binlog Dump | 297 | Master has sent all binlog to slave; waiting for more updates | NULL |
| 212495 | system user | Slave_IO | 20 | Waiting for master to send event | NULL |
| 212497 | system user | Slave_worker | 0 | Waiting for prior transaction to commit | NULL |
| 212498 | system user | Slave_worker | 0 | Waiting for prior transaction to commit | NULL |
| 212499 | system user | Slave_worker | 0 | Waiting for prior transaction to commit | NULL |
| 212500 | system user | Slave_worker | 0 | Waiting for prior transaction to commit | NULL |
| 212501 | system user | Slave_worker | 0 | Write_rows_log_event::write_row(-1) on table `history_uint` | insert ... |
| 212502 | system user | Slave_worker | 0 | Write_rows_log_event::write_row(-1) on table `history_uint` | insert ... |
| 212503 | system user | Slave_worker | 0 | Write_rows_log_event::write_row(-1) on table `history_str` | insert ... |
| 212504 | system user | Slave_worker | 0 | Waiting for prior transaction to commit | NULL |
| 212505 | system user | Slave_worker | 0 | Waiting for prior transaction to commit | NULL |
| 212506 | system user | Slave_worker | 0 | Waiting for prior transaction to commit | NULL |
| 212507 | system user | Slave_worker | 0 | Waiting for prior transaction to commit | NULL |
| 212510 | system user | Slave_worker | 0 | Waiting for prior transaction to commit | NULL |
| 212509 | system user | Slave_worker | 0 | Waiting for prior transaction to commit | NULL |
| 212508 | system user | Slave_worker | 0 | Waiting for prior transaction to commit | NULL |
| 212511 | system user | Slave_worker | 0 | Waiting for prior transaction to commit | NULL |
| 212512 | system user | Slave_worker | 0 | Waiting for prior transaction to commit | NULL |
| 212496 | system user | Slave_SQL | 16 | Waiting for room in worker thread event queue | NULL |
+--------+-----------------+--------------+--------+---------------------------------------------------------------+------------+
SQL > SHOW PROCESSLIST;
+--------+-----------------+--------------+--------+---------------------------------------------------------------+------------+
| Id | User | Command | Time | State | Info |
+--------+-----------------+--------------+--------+---------------------------------------------------------------+------------+
| 2 | event_scheduler | Daemon | 506197 | Waiting for next activation | NULL |
| 191154 | root | Query | 0 | starting | show pr... |
| 208669 | replication | Binlog Dump | 315 | Master has sent all binlog to slave; waiting for more updates | NULL |
| 212495 | system user | Slave_IO | 37 | Waiting for master to send event | NULL |
| 212497 | system user | Slave_worker | 0 | Delete_rows_log_event::ha_delete_row(-1) on table `history` | delete ... |
| 212498 | system user | Slave_worker | 0 | Delete_rows_log_event::find_row(-1) on table `history` | delete ... |
| 212499 | system user | Slave_worker | 0 | Delete_rows_log_event::ha_delete_row(-1) on table `history` | delete ... |
| 212500 | system user | Slave_worker | 0 | Delete_rows_log_event::find_row(-1) on table `history` | delete ... |
| 212501 | system user | Slave_worker | 0 | Delete_rows_log_event::find_row(-1) on table `history` | delete ... |
| 212502 | system user | Slave_worker | 0 | Delete_rows_log_event::find_row(-1) on table `history` | delete ... |
| 212503 | system user | Slave_worker | 0 | Delete_rows_log_event::find_row(-1) on table `history` | delete ... |
| 212504 | system user | Slave_worker | 0 | Delete_rows_log_event::ha_delete_row(-1) on table `history` | delete ... |
| 212505 | system user | Slave_worker | 0 | Delete_rows_log_event::find_row(-1) on table `history` | delete ... |
| 212506 | system user | Slave_worker | 0 | Delete_rows_log_event::ha_delete_row(-1) on table `history` | delete ... |
| 212507 | system user | Slave_worker | 0 | Delete_rows_log_event::find_row(-1) on table `history` | delete ... |
| 212510 | system user | Slave_worker | 0 | Delete_rows_log_event::find_row(-1) on table `history` | delete ... |
| 212509 | system user | Slave_worker | 0 | Delete_rows_log_event::find_row(-1) on table `history` | delete ... |
| 212508 | system user | Slave_worker | 0 | Delete_rows_log_event::find_row(-1) on table `history` | delete ... |
| 212511 | system user | Slave_worker | 0 | Delete_rows_log_event::find_row(-1) on table `history` | delete ... |
| 212512 | system user | Slave_worker | 0 | Delete_rows_log_event::find_row(-1) on table `history` | delete ... |
| 212496 | system user | Slave_SQL | 11 | Waiting for room in worker thread event queue | NULL |
+--------+-----------------+--------------+--------+---------------------------------------------------------------+------------+
Our monitoring also showed us that the CPU load went up, the I/O system got more to do and more rows were modified...
What was also noticeable is that with parallel replication, Foreign Key errors suddenly occurred, a phenomenon that we had not observed before:
FromDual.maas2.prod2 - Warning: InnoDB Foreign Key error detected
Trigger: InnoDB Foreign Key error detected
Trigger status: PROBLEM
Trigger severity: Warning
Trigger URL: https://fromdual.com/innodb-foreign-key-error-detected
Item values: 1
1. InnoDB new Foreign Key error (FromDual.maas2.prod2:FromDual.MySQL.innodb.ForeignKey_new): 1
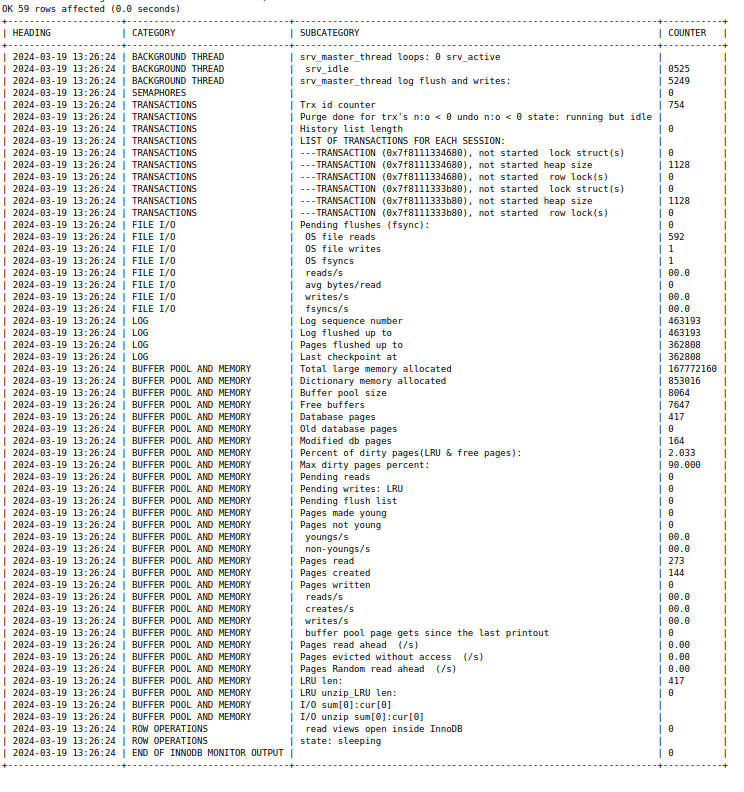
With the command SHOW ENGINE INNODB STATUSG you can inspect these accordingly or view them in the monitoring:
------------------------
LATEST FOREIGN KEY ERROR
------------------------
2024-04-02 10:36:39 0x7f36088ff640 Transaction:
TRANSACTION 7199599266, ACTIVE 0 sec inserting
mysql tables in use 1, locked 1
6 lock struct(s), heap size 1128, 3 row lock(s), undo log entries 1
MariaDB thread id 228555, OS thread handle 139870048613952, query id 28453893 Write_rows_log_event::write_row(-1) on table `alerts`
insert into alerts (alertid,actionid,eventid,userid,clock,mediatypeid,sendto,subject,message,status,error,esc_step,alerttype,acknowledgeid,parameters) values (203687,4,471733,3,1712044003,1,\'xxx@fromdual.com\',\'Zabbix server - High: Too many processes on Zabbix server\',\'Trigger: Too many processes on Zabbix server
Trigger status: PROBLEM
Trigger severity: High
Trigger URL:
Item values: 309
1. Number of processes (Zabbix server:proc.num[]): 309\',3,\'\',1,0,null,\'{}\')
Foreign key constraint fails for table `zabbix`.`alerts`:
,
CONSTRAINT `c_alerts_2` FOREIGN KEY (`eventid`) REFERENCES `events` (`eventid`) ON DELETE CASCADE in parent table, in index alerts_3 tuple:
DATA TUPLE: 2 fields;
...
But in parent table `zabbix`.`events`, in index PRIMARY,
the closest match we can find is record:
PHYSICAL RECORD: n_fields 12; compact format; info bits 0
...
Literature/Sources
Parallel Replication
Taxonomy upgrade extras: replicationmariadbparallelmulti-threaded
The post MariaDB's parallel replication to catch up appeared first on MariaDB.org.
]]>Due to an application error, our replication stopped for 5 days (over Easter). After the problem was solved, the replication was supposed to catch up, which turned out to be very slow. All the usual tricks (innodb_flush_log_at_trx_commit, sync_binlog, etc.) had already been exhausted. So we tried our hand at parallel replication of the MariaDB server.
Parallel replication is deactivated by default:
SQL> SHOW GLOBAL VARIABLES LIKE '%parallel%';
+-------------------------------+------------+
| Variable_name                 | Value      |
+-------------------------------+------------+
| slave_domain_parallel_threads | 0          |
| slave_parallel_max_queued     | 131072     |
| slave_parallel_mode           | optimistic |
| slave_parallel_threads        | 0          |
| slave_parallel_workers        | 0          |
+-------------------------------+------------+
Parallel replication is activated by setting the server variables slave_parallel_threads:
SQL> SET GLOBAL slave_parallel_threads = 8;
ERROR 1198 (HY000): This operation cannot be performed as you have a running slave ''; run STOP SLAVE '' first
However, this must be done when replication is stopped:
SQL> STOP SLAVE;
SQL> SET GLOBAL slave_parallel_threads = 8;
SQL> START SLAVE;
Replication then caught up a little faster. However, as we were impatient, we tried to make it even faster. With the command:
SQL> SHOW SLAVE STATUSG
...
Slave_SQL_Running_State: Waiting for room in worker thread event queue
...
we found the following message. You would also see it using the SHOW PROCESSLIST command:
SQL> SHOW PROCESSLIST;
+--------+-------------+- ... -+-----------+------+-----------------------------------------------+- ... -+
| Id     | User        |  ...  | Command   | Time | State                                         |  ...  |
+--------+-------------+- ... -+-----------+------+-----------------------------------------------+- ... -+
...                       ...                                                                        ...
| 212496 | system user |  ...  | Slave_SQL |   16 | Waiting for room in worker thread event queue |  ...  |
+--------+-------------+- ... -+-----------+------+-----------------------------------------------+- ... -+
According to the documentation, it can help in this case to increase the size of the slave_parallel_max_queued variable slightly (attention: Oom!).
SQL> STOP SLAVE;
SQL> SET GLOBAL slave_parallel_max_queued = 1*1024*1024;
SQL> SHOW GLOBAL VARIABLES LIKE '%parallel%';
+-------------------------------+------------+
| Variable_name                 | Value      |
+-------------------------------+------------+
| slave_domain_parallel_threads | 0          |
| slave_parallel_max_queued     | 1048576    |
| slave_parallel_mode           | optimistic |
| slave_parallel_threads        | 8          |
| slave_parallel_workers        | 8          |
+-------------------------------+------------+
SQL> START SLAVE;
We have played around with the values slave_parallel_threads in the range from 4 to 32 (with 8 vCores) and with slave_parallel_max_queued in the range from 128 kbyte to 32 Mbyte.
Caution: Do not exaggerate: 32 threads x 32 Mbyte = 1 Gbyte RAM (Oom)!
To find out which values are the optimum, you would have to test and measure more extensively. In any case, the replication made up the 5-day backlog after about an hour, towards the end a little more than at the beginning, which was hopefully caused by our configuration adjustments.

Depending on what DML statements are currently running, you can see that all threads can be used or that some threads have to wait for other threads:
SQL> SHOW PROCESSLIST;
+--------+-----------------+--------------+--------+---------------------------------------------------------------+------------+
| Id     | User            | Command      | Time   | State                                                         | Info       |
+--------+-----------------+--------------+--------+---------------------------------------------------------------+------------+
|      2 | event_scheduler | Daemon       | 506179 | Waiting for next activation                                   | NULL       |
| 191154 | root            | Query        |      0 | starting                                                      | show pr... |
| 208669 | replication     | Binlog Dump  |    297 | Master has sent all binlog to slave; waiting for more updates | NULL       |
| 212495 | system user     | Slave_IO     |     20 | Waiting for master to send event                              | NULL       |
| 212497 | system user     | Slave_worker |      0 | Waiting for prior transaction to commit                       | NULL       |
| 212498 | system user     | Slave_worker |      0 | Waiting for prior transaction to commit                       | NULL       |
| 212499 | system user     | Slave_worker |      0 | Waiting for prior transaction to commit                       | NULL       |
| 212500 | system user     | Slave_worker |      0 | Waiting for prior transaction to commit                       | NULL       |
| 212501 | system user     | Slave_worker |      0 | Write_rows_log_event::write_row(-1) on table `history_uint`   | insert ... |
| 212502 | system user     | Slave_worker |      0 | Write_rows_log_event::write_row(-1) on table `history_uint`   | insert ... |
| 212503 | system user     | Slave_worker |      0 | Write_rows_log_event::write_row(-1) on table `history_str`    | insert ... |
| 212504 | system user     | Slave_worker |      0 | Waiting for prior transaction to commit                       | NULL       |
| 212505 | system user     | Slave_worker |      0 | Waiting for prior transaction to commit                       | NULL       |
| 212506 | system user     | Slave_worker |      0 | Waiting for prior transaction to commit                       | NULL       |
| 212507 | system user     | Slave_worker |      0 | Waiting for prior transaction to commit                       | NULL       |
| 212510 | system user     | Slave_worker |      0 | Waiting for prior transaction to commit                       | NULL       |
| 212509 | system user     | Slave_worker |      0 | Waiting for prior transaction to commit                       | NULL       |
| 212508 | system user     | Slave_worker |      0 | Waiting for prior transaction to commit                       | NULL       |
| 212511 | system user     | Slave_worker |      0 | Waiting for prior transaction to commit                       | NULL       |
| 212512 | system user     | Slave_worker |      0 | Waiting for prior transaction to commit                       | NULL       |
| 212496 | system user     | Slave_SQL    |     16 | Waiting for room in worker thread event queue                 | NULL       |
+--------+-----------------+--------------+--------+---------------------------------------------------------------+------------+

SQL> SHOW PROCESSLIST;
+--------+-----------------+--------------+--------+---------------------------------------------------------------+------------+
| Id     | User            | Command      | Time   | State                                                         | Info       |
+--------+-----------------+--------------+--------+---------------------------------------------------------------+------------+
|      2 | event_scheduler | Daemon       | 506197 | Waiting for next activation                                   | NULL       |
| 191154 | root            | Query        |      0 | starting                                                      | show pr... |
| 208669 | replication     | Binlog Dump  |    315 | Master has sent all binlog to slave; waiting for more updates | NULL       |
| 212495 | system user     | Slave_IO     |     37 | Waiting for master to send event                              | NULL       |
| 212497 | system user     | Slave_worker |      0 | Delete_rows_log_event::ha_delete_row(-1) on table `history`   | delete ... |
| 212498 | system user     | Slave_worker |      0 | Delete_rows_log_event::find_row(-1) on table `history`        | delete ... |
| 212499 | system user     | Slave_worker |      0 | Delete_rows_log_event::ha_delete_row(-1) on table `history`   | delete ... |
| 212500 | system user     | Slave_worker |      0 | Delete_rows_log_event::find_row(-1) on table `history`        | delete ... |
| 212501 | system user     | Slave_worker |      0 | Delete_rows_log_event::find_row(-1) on table `history`        | delete ... |
| 212502 | system user     | Slave_worker |      0 | Delete_rows_log_event::find_row(-1) on table `history`        | delete ... |
| 212503 | system user     | Slave_worker |      0 | Delete_rows_log_event::find_row(-1) on table `history`        | delete ... |
| 212504 | system user     | Slave_worker |      0 | Delete_rows_log_event::ha_delete_row(-1) on table `history`   | delete ... |
| 212505 | system user     | Slave_worker |      0 | Delete_rows_log_event::find_row(-1) on table `history`        | delete ... |
| 212506 | system user     | Slave_worker |      0 | Delete_rows_log_event::ha_delete_row(-1) on table `history`   | delete ... |
| 212507 | system user     | Slave_worker |      0 | Delete_rows_log_event::find_row(-1) on table `history`        | delete ... |
| 212510 | system user     | Slave_worker |      0 | Delete_rows_log_event::find_row(-1) on table `history`        | delete ... |
| 212509 | system user     | Slave_worker |      0 | Delete_rows_log_event::find_row(-1) on table `history`        | delete ... |
| 212508 | system user     | Slave_worker |      0 | Delete_rows_log_event::find_row(-1) on table `history`        | delete ... |
| 212511 | system user     | Slave_worker |      0 | Delete_rows_log_event::find_row(-1) on table `history`        | delete ... |
| 212512 | system user     | Slave_worker |      0 | Delete_rows_log_event::find_row(-1) on table `history`        | delete ... |
| 212496 | system user     | Slave_SQL    |     11 | Waiting for room in worker thread event queue                 | NULL       |
+--------+-----------------+--------------+--------+---------------------------------------------------------------+------------+
Our monitoring also showed us that the CPU load went up, the I/O system got more to do and more rows were modified…


What was also noticeable is that with parallel replication, Foreign Key errors suddenly occurred, a phenomenon that we had not observed before:
FromDual.maas2.prod2 - Warning: InnoDB Foreign Key error detected

Trigger: InnoDB Foreign Key error detected
Trigger status: PROBLEM
Trigger severity: Warning
Trigger URL: https://fromdual.com/innodb-foreign-key-error-detected

Item values: 1

1. InnoDB new Foreign Key error (FromDual.maas2.prod2:FromDual.MySQL.innodb.ForeignKey_new): 1
With the command SHOW ENGINE INNODB STATUSG you can inspect these accordingly or view them in the monitoring:
------------------------
LATEST FOREIGN KEY ERROR
------------------------
2024-04-02 10:36:39 0x7f36088ff640 Transaction:
TRANSACTION 7199599266, ACTIVE 0 sec inserting
mysql tables in use 1, locked 1
6 lock struct(s), heap size 1128, 3 row lock(s), undo log entries 1
MariaDB thread id 228555, OS thread handle 139870048613952, query id 28453893 Write_rows_log_event::write_row(-1) on table `alerts`
insert into alerts (alertid,actionid,eventid,userid,clock,mediatypeid,sendto,subject,message,status,error,esc_step,alerttype,acknowledgeid,parameters) values (203687,4,471733,3,1712044003,1,'xxx@fromdual.com','Zabbix server - High: Too many processes on Zabbix server','Trigger: Too many processes on Zabbix server
Trigger status: PROBLEM
Trigger severity: High
Trigger URL:

Item values: 309

1. Number of processes (Zabbix server:proc.num[]): 309',3,'',1,0,null,'{}')
Foreign key constraint fails for table `zabbix`.`alerts`:
,
  CONSTRAINT `c_alerts_2` FOREIGN KEY (`eventid`) REFERENCES `events` (`eventid`) ON DELETE CASCADE in parent table, in index alerts_3 tuple:
DATA TUPLE: 2 fields;
 ...

But in parent table `zabbix`.`events`, in index PRIMARY,
the closest match we can find is record:
PHYSICAL RECORD: n_fields 12; compact format; info bits 0
 ...
The post MariaDB's parallel replication to catch up appeared first on MariaDB.org.
]]>Parallel replication is deactivated by default:
SQL > SHOW GLOBAL VARIABLES LIKE \'%parallel%\';
+-------------------------------+------------+
| Variable_name | Value |
+-------------------------------+------------+
| slave_domain_parallel_threads | 0 |
| slave_parallel_max_queued | 131072 |
| slave_parallel_mode | optimistic |
| slave_parallel_threads | 0 |
| slave_parallel_workers | 0 |
+-------------------------------+------------+
Parallel replication is activated by setting the server variables slave_parallel_threads:
SQL > SET GLOBAL slave_parallel_threads = 8;
ERROR 1198 (HY000): This operation cannot be performed as you have a running slave \'\'; run STOP SLAVE \'\' first
However, this must be done when replication is stopped:
SQL > STOP SLAVE;
SQL > SET GLOBAL slave_parallel_threads = 8;
SQL > START SLAVE;
Replication then caught up a little faster. However, as we were impatient, we tried to make it even faster. With the command:
SQL > SHOW SLAVE STATUSG
...
Slave_SQL_Running_State: Waiting for room in worker thread event queue
...
we found the following message. You would also see it using the SHOW PROCESSLIST command:
SQL > SHOW PROCESSLIST;
+--------+-------------+- ... -+-----------+------+-----------------------------------------------+- ... -+
| Id | User | ... | Command | Time | State | ... |
+--------+-------------+- ... -+-----------+------+-----------------------------------------------+- ... -+
... ... ...
| 212496 | system user | ... | Slave_SQL | 16 | Waiting for room in worker thread event queue | ... |
+--------+-------------+- ... -+-----------+------+-----------------------------------------------+- ... -+
According to the documentation, it can help in this case to increase the size of the slave_parallel_max_queued variable slightly (attention: Oom!).
SQL > STOP SLAVE;
SQL > SET GLOBAL slave_parallel_max_queued = 1*1024*1024;
SQL > SHOW GLOBAL VARIABLES LIKE \'%parallel%\';
+-------------------------------+------------+
| Variable_name | Value |
+-------------------------------+------------+
| slave_domain_parallel_threads | 0 |
| slave_parallel_max_queued | 1048576 |
| slave_parallel_mode | optimistic |
| slave_parallel_threads | 8 |
| slave_parallel_workers | 8 |
+-------------------------------+------------+
SQL > START SLAVE;
We have played around with the values slave_parallel_threads in the range from 4 to 32 (with 8 vCores) and with slave_parallel_max_queued in the range from 128 kbyte to 32 Mbyte.
Caution: Do not exaggerate: 32 threads x 32 Mbyte = 1 Gbyte RAM (Oom)!
To find out which values are the optimum, you would have to test and measure more extensively. In any case, the replication made up the 5-day backlog after about an hour, towards the end a little more than at the beginning, which was hopefully caused by our configuration adjustments.
Depending on what DML statements are currently running, you can see that all threads can be used or that some threads have to wait for other threads:
SQL > SHOW PROCESSLIST;
+--------+-----------------+--------------+--------+---------------------------------------------------------------+------------+
| Id | User | Command | Time | State | Info |
+--------+-----------------+--------------+--------+---------------------------------------------------------------+------------+
| 2 | event_scheduler | Daemon | 506179 | Waiting for next activation | NULL |
| 191154 | root | Query | 0 | starting | show pr... |
| 208669 | replication | Binlog Dump | 297 | Master has sent all binlog to slave; waiting for more updates | NULL |
| 212495 | system user | Slave_IO | 20 | Waiting for master to send event | NULL |
| 212497 | system user | Slave_worker | 0 | Waiting for prior transaction to commit | NULL |
| 212498 | system user | Slave_worker | 0 | Waiting for prior transaction to commit | NULL |
| 212499 | system user | Slave_worker | 0 | Waiting for prior transaction to commit | NULL |
| 212500 | system user | Slave_worker | 0 | Waiting for prior transaction to commit | NULL |
| 212501 | system user | Slave_worker | 0 | Write_rows_log_event::write_row(-1) on table `history_uint` | insert ... |
| 212502 | system user | Slave_worker | 0 | Write_rows_log_event::write_row(-1) on table `history_uint` | insert ... |
| 212503 | system user | Slave_worker | 0 | Write_rows_log_event::write_row(-1) on table `history_str` | insert ... |
| 212504 | system user | Slave_worker | 0 | Waiting for prior transaction to commit | NULL |
| 212505 | system user | Slave_worker | 0 | Waiting for prior transaction to commit | NULL |
| 212506 | system user | Slave_worker | 0 | Waiting for prior transaction to commit | NULL |
| 212507 | system user | Slave_worker | 0 | Waiting for prior transaction to commit | NULL |
| 212510 | system user | Slave_worker | 0 | Waiting for prior transaction to commit | NULL |
| 212509 | system user | Slave_worker | 0 | Waiting for prior transaction to commit | NULL |
| 212508 | system user | Slave_worker | 0 | Waiting for prior transaction to commit | NULL |
| 212511 | system user | Slave_worker | 0 | Waiting for prior transaction to commit | NULL |
| 212512 | system user | Slave_worker | 0 | Waiting for prior transaction to commit | NULL |
| 212496 | system user | Slave_SQL | 16 | Waiting for room in worker thread event queue | NULL |
+--------+-----------------+--------------+--------+---------------------------------------------------------------+------------+
SQL > SHOW PROCESSLIST;
+--------+-----------------+--------------+--------+---------------------------------------------------------------+------------+
| Id | User | Command | Time | State | Info |
+--------+-----------------+--------------+--------+---------------------------------------------------------------+------------+
| 2 | event_scheduler | Daemon | 506197 | Waiting for next activation | NULL |
| 191154 | root | Query | 0 | starting | show pr... |
| 208669 | replication | Binlog Dump | 315 | Master has sent all binlog to slave; waiting for more updates | NULL |
| 212495 | system user | Slave_IO | 37 | Waiting for master to send event | NULL |
| 212497 | system user | Slave_worker | 0 | Delete_rows_log_event::ha_delete_row(-1) on table `history` | delete ... |
| 212498 | system user | Slave_worker | 0 | Delete_rows_log_event::find_row(-1) on table `history` | delete ... |
| 212499 | system user | Slave_worker | 0 | Delete_rows_log_event::ha_delete_row(-1) on table `history` | delete ... |
| 212500 | system user | Slave_worker | 0 | Delete_rows_log_event::find_row(-1) on table `history` | delete ... |
| 212501 | system user | Slave_worker | 0 | Delete_rows_log_event::find_row(-1) on table `history` | delete ... |
| 212502 | system user | Slave_worker | 0 | Delete_rows_log_event::find_row(-1) on table `history` | delete ... |
| 212503 | system user | Slave_worker | 0 | Delete_rows_log_event::find_row(-1) on table `history` | delete ... |
| 212504 | system user | Slave_worker | 0 | Delete_rows_log_event::ha_delete_row(-1) on table `history` | delete ... |
| 212505 | system user | Slave_worker | 0 | Delete_rows_log_event::find_row(-1) on table `history` | delete ... |
| 212506 | system user | Slave_worker | 0 | Delete_rows_log_event::ha_delete_row(-1) on table `history` | delete ... |
| 212507 | system user | Slave_worker | 0 | Delete_rows_log_event::find_row(-1) on table `history` | delete ... |
| 212510 | system user | Slave_worker | 0 | Delete_rows_log_event::find_row(-1) on table `history` | delete ... |
| 212509 | system user | Slave_worker | 0 | Delete_rows_log_event::find_row(-1) on table `history` | delete ... |
| 212508 | system user | Slave_worker | 0 | Delete_rows_log_event::find_row(-1) on table `history` | delete ... |
| 212511 | system user | Slave_worker | 0 | Delete_rows_log_event::find_row(-1) on table `history` | delete ... |
| 212512 | system user | Slave_worker | 0 | Delete_rows_log_event::find_row(-1) on table `history` | delete ... |
| 212496 | system user | Slave_SQL | 11 | Waiting for room in worker thread event queue | NULL |
+--------+-----------------+--------------+--------+---------------------------------------------------------------+------------+
Our monitoring also showed us that the CPU load went up, the I/O system got more to do and more rows were modified...
What was also noticeable is that with parallel replication, Foreign Key errors suddenly occurred, a phenomenon that we had not observed before:
FromDual.maas2.prod2 - Warning: InnoDB Foreign Key error detected
Trigger: InnoDB Foreign Key error detected
Trigger status: PROBLEM
Trigger severity: Warning
Trigger URL: https://fromdual.com/innodb-foreign-key-error-detected
Item values: 1
1. InnoDB new Foreign Key error (FromDual.maas2.prod2:FromDual.MySQL.innodb.ForeignKey_new): 1
With the command SHOW ENGINE INNODB STATUSG you can inspect these accordingly or view them in the monitoring:
------------------------
LATEST FOREIGN KEY ERROR
------------------------
2024-04-02 10:36:39 0x7f36088ff640 Transaction:
TRANSACTION 7199599266, ACTIVE 0 sec inserting
mysql tables in use 1, locked 1
6 lock struct(s), heap size 1128, 3 row lock(s), undo log entries 1
MariaDB thread id 228555, OS thread handle 139870048613952, query id 28453893 Write_rows_log_event::write_row(-1) on table `alerts`
insert into alerts (alertid,actionid,eventid,userid,clock,mediatypeid,sendto,subject,message,status,error,esc_step,alerttype,acknowledgeid,parameters) values (203687,4,471733,3,1712044003,1,\'xxx@fromdual.com\',\'Zabbix server - High: Too many processes on Zabbix server\',\'Trigger: Too many processes on Zabbix server
Trigger status: PROBLEM
Trigger severity: High
Trigger URL:
Item values: 309
1. Number of processes (Zabbix server:proc.num[]): 309\',3,\'\',1,0,null,\'{}\')
Foreign key constraint fails for table `zabbix`.`alerts`:
,
CONSTRAINT `c_alerts_2` FOREIGN KEY (`eventid`) REFERENCES `events` (`eventid`) ON DELETE CASCADE in parent table, in index alerts_3 tuple:
DATA TUPLE: 2 fields;
...
But in parent table `zabbix`.`events`, in index PRIMARY,
the closest match we can find is record:
PHYSICAL RECORD: n_fields 12; compact format; info bits 0
...
Literature/Sources
Parallel Replication
Taxonomy upgrade extras: replicationmariadbparallelmulti-threaded
The post Shinguz: MariaDB's parallel replication to catch up appeared first on MariaDB.org.
]]>Due to an application error, our replication stopped for 5 days (over Easter). After the problem was solved, the replication was supposed to catch up, which turned out to be very slow. All the usual tricks (innodb_flush_log_at_trx_commit, sync_binlog, etc.) had already been exhausted. So we tried our hand at parallel replication of the MariaDB server.
Parallel replication is deactivated by default:
SQL> SHOW GLOBAL VARIABLES LIKE '%parallel%';
+-------------------------------+------------+
| Variable_name                 | Value      |
+-------------------------------+------------+
| slave_domain_parallel_threads | 0          |
| slave_parallel_max_queued     | 131072     |
| slave_parallel_mode           | optimistic |
| slave_parallel_threads        | 0          |
| slave_parallel_workers        | 0          |
+-------------------------------+------------+
Parallel replication is activated by setting the server variables slave_parallel_threads:
SQL> SET GLOBAL slave_parallel_threads = 8;
ERROR 1198 (HY000): This operation cannot be performed as you have a running slave ''; run STOP SLAVE '' first
However, this must be done when replication is stopped:
SQL> STOP SLAVE;
SQL> SET GLOBAL slave_parallel_threads = 8;
SQL> START SLAVE;
Replication then caught up a little faster. However, as we were impatient, we tried to make it even faster. With the command:
SQL> SHOW SLAVE STATUSG
...
Slave_SQL_Running_State: Waiting for room in worker thread event queue
...
we found the following message. You would also see it using the SHOW PROCESSLIST command:
SQL> SHOW PROCESSLIST;
+--------+-------------+- ... -+-----------+------+-----------------------------------------------+- ... -+
| Id     | User        |  ...  | Command   | Time | State                                         |  ...  |
+--------+-------------+- ... -+-----------+------+-----------------------------------------------+- ... -+
...                       ...                                                                        ...
| 212496 | system user |  ...  | Slave_SQL |   16 | Waiting for room in worker thread event queue |  ...  |
+--------+-------------+- ... -+-----------+------+-----------------------------------------------+- ... -+
According to the documentation, it can help in this case to increase the size of the slave_parallel_max_queued variable slightly (attention: Oom!).
SQL> STOP SLAVE;
SQL> SET GLOBAL slave_parallel_max_queued = 1*1024*1024;
SQL> SHOW GLOBAL VARIABLES LIKE '%parallel%';
+-------------------------------+------------+
| Variable_name                 | Value      |
+-------------------------------+------------+
| slave_domain_parallel_threads | 0          |
| slave_parallel_max_queued     | 1048576    |
| slave_parallel_mode           | optimistic |
| slave_parallel_threads        | 8          |
| slave_parallel_workers        | 8          |
+-------------------------------+------------+
SQL> START SLAVE;
We have played around with the values slave_parallel_threads in the range from 4 to 32 (with 8 vCores) and with slave_parallel_max_queued in the range from 128 kbyte to 32 Mbyte.
Caution: Do not exaggerate: 32 threads x 32 Mbyte = 1 Gbyte RAM (Oom)!
To find out which values are the optimum, you would have to test and measure more extensively. In any case, the replication made up the 5-day backlog after about an hour, towards the end a little more than at the beginning, which was hopefully caused by our configuration adjustments.
Depending on what DML statements are currently running, you can see that all threads can be used or that some threads have to wait for other threads:
SQL> SHOW PROCESSLIST;
+--------+-----------------+--------------+--------+---------------------------------------------------------------+------------+
| Id     | User            | Command      | Time   | State                                                         | Info       |
+--------+-----------------+--------------+--------+---------------------------------------------------------------+------------+
|      2 | event_scheduler | Daemon       | 506179 | Waiting for next activation                                   | NULL       |
| 191154 | root            | Query        |      0 | starting                                                      | show pr... |
| 208669 | replication     | Binlog Dump  |    297 | Master has sent all binlog to slave; waiting for more updates | NULL       |
| 212495 | system user     | Slave_IO     |     20 | Waiting for master to send event                              | NULL       |
| 212497 | system user     | Slave_worker |      0 | Waiting for prior transaction to commit                       | NULL       |
| 212498 | system user     | Slave_worker |      0 | Waiting for prior transaction to commit                       | NULL       |
| 212499 | system user     | Slave_worker |      0 | Waiting for prior transaction to commit                       | NULL       |
| 212500 | system user     | Slave_worker |      0 | Waiting for prior transaction to commit                       | NULL       |
| 212501 | system user     | Slave_worker |      0 | Write_rows_log_event::write_row(-1) on table `history_uint`   | insert ... |
| 212502 | system user     | Slave_worker |      0 | Write_rows_log_event::write_row(-1) on table `history_uint`   | insert ... |
| 212503 | system user     | Slave_worker |      0 | Write_rows_log_event::write_row(-1) on table `history_str`    | insert ... |
| 212504 | system user     | Slave_worker |      0 | Waiting for prior transaction to commit                       | NULL       |
| 212505 | system user     | Slave_worker |      0 | Waiting for prior transaction to commit                       | NULL       |
| 212506 | system user     | Slave_worker |      0 | Waiting for prior transaction to commit                       | NULL       |
| 212507 | system user     | Slave_worker |      0 | Waiting for prior transaction to commit                       | NULL       |
| 212510 | system user     | Slave_worker |      0 | Waiting for prior transaction to commit                       | NULL       |
| 212509 | system user     | Slave_worker |      0 | Waiting for prior transaction to commit                       | NULL       |
| 212508 | system user     | Slave_worker |      0 | Waiting for prior transaction to commit                       | NULL       |
| 212511 | system user     | Slave_worker |      0 | Waiting for prior transaction to commit                       | NULL       |
| 212512 | system user     | Slave_worker |      0 | Waiting for prior transaction to commit                       | NULL       |
| 212496 | system user     | Slave_SQL    |     16 | Waiting for room in worker thread event queue                 | NULL       |
+--------+-----------------+--------------+--------+---------------------------------------------------------------+------------+

SQL> SHOW PROCESSLIST;
+--------+-----------------+--------------+--------+---------------------------------------------------------------+------------+
| Id     | User            | Command      | Time   | State                                                         | Info       |
+--------+-----------------+--------------+--------+---------------------------------------------------------------+------------+
|      2 | event_scheduler | Daemon       | 506197 | Waiting for next activation                                   | NULL       |
| 191154 | root            | Query        |      0 | starting                                                      | show pr... |
| 208669 | replication     | Binlog Dump  |    315 | Master has sent all binlog to slave; waiting for more updates | NULL       |
| 212495 | system user     | Slave_IO     |     37 | Waiting for master to send event                              | NULL       |
| 212497 | system user     | Slave_worker |      0 | Delete_rows_log_event::ha_delete_row(-1) on table `history`   | delete ... |
| 212498 | system user     | Slave_worker |      0 | Delete_rows_log_event::find_row(-1) on table `history`        | delete ... |
| 212499 | system user     | Slave_worker |      0 | Delete_rows_log_event::ha_delete_row(-1) on table `history`   | delete ... |
| 212500 | system user     | Slave_worker |      0 | Delete_rows_log_event::find_row(-1) on table `history`        | delete ... |
| 212501 | system user     | Slave_worker |      0 | Delete_rows_log_event::find_row(-1) on table `history`        | delete ... |
| 212502 | system user     | Slave_worker |      0 | Delete_rows_log_event::find_row(-1) on table `history`        | delete ... |
| 212503 | system user     | Slave_worker |      0 | Delete_rows_log_event::find_row(-1) on table `history`        | delete ... |
| 212504 | system user     | Slave_worker |      0 | Delete_rows_log_event::ha_delete_row(-1) on table `history`   | delete ... |
| 212505 | system user     | Slave_worker |      0 | Delete_rows_log_event::find_row(-1) on table `history`        | delete ... |
| 212506 | system user     | Slave_worker |      0 | Delete_rows_log_event::ha_delete_row(-1) on table `history`   | delete ... |
| 212507 | system user     | Slave_worker |      0 | Delete_rows_log_event::find_row(-1) on table `history`        | delete ... |
| 212510 | system user     | Slave_worker |      0 | Delete_rows_log_event::find_row(-1) on table `history`        | delete ... |
| 212509 | system user     | Slave_worker |      0 | Delete_rows_log_event::find_row(-1) on table `history`        | delete ... |
| 212508 | system user     | Slave_worker |      0 | Delete_rows_log_event::find_row(-1) on table `history`        | delete ... |
| 212511 | system user     | Slave_worker |      0 | Delete_rows_log_event::find_row(-1) on table `history`        | delete ... |
| 212512 | system user     | Slave_worker |      0 | Delete_rows_log_event::find_row(-1) on table `history`        | delete ... |
| 212496 | system user     | Slave_SQL    |     11 | Waiting for room in worker thread event queue                 | NULL       |
+--------+-----------------+--------------+--------+---------------------------------------------------------------+------------+
Our monitoring also showed us that the CPU load went up, the I/O system got more to do and more rows were modified…
What was also noticeable is that with parallel replication, Foreign Key errors suddenly occurred, a phenomenon that we had not observed before:
FromDual.maas2.prod2 - Warning: InnoDB Foreign Key error detected

Trigger: InnoDB Foreign Key error detected
Trigger status: PROBLEM
Trigger severity: Warning
Trigger URL: https://fromdual.com/innodb-foreign-key-error-detected

Item values: 1

1. InnoDB new Foreign Key error (FromDual.maas2.prod2:FromDual.MySQL.innodb.ForeignKey_new): 1
With the command SHOW ENGINE INNODB STATUSG you can inspect these accordingly or view them in the monitoring:
------------------------
LATEST FOREIGN KEY ERROR
------------------------
2024-04-02 10:36:39 0x7f36088ff640 Transaction:
TRANSACTION 7199599266, ACTIVE 0 sec inserting
mysql tables in use 1, locked 1
6 lock struct(s), heap size 1128, 3 row lock(s), undo log entries 1
MariaDB thread id 228555, OS thread handle 139870048613952, query id 28453893 Write_rows_log_event::write_row(-1) on table `alerts`
insert into alerts (alertid,actionid,eventid,userid,clock,mediatypeid,sendto,subject,message,status,error,esc_step,alerttype,acknowledgeid,parameters) values (203687,4,471733,3,1712044003,1,'xxx@fromdual.com','Zabbix server - High: Too many processes on Zabbix server','Trigger: Too many processes on Zabbix server
Trigger status: PROBLEM
Trigger severity: High
Trigger URL:

Item values: 309

1. Number of processes (Zabbix server:proc.num[]): 309',3,'',1,0,null,'{}')
Foreign key constraint fails for table `zabbix`.`alerts`:
,
  CONSTRAINT `c_alerts_2` FOREIGN KEY (`eventid`) REFERENCES `events` (`eventid`) ON DELETE CASCADE in parent table, in index alerts_3 tuple:
DATA TUPLE: 2 fields;
 ...

But in parent table `zabbix`.`events`, in index PRIMARY,
the closest match we can find is record:
PHYSICAL RECORD: n_fields 12; compact format; info bits 0
 ...
The post Shinguz: MariaDB's parallel replication to catch up appeared first on MariaDB.org.
]]>I followed the MariaDB documentation Get, Build and Test Latest MariaDB the Lazy Way to build the server.
On Ubuntu 22.04 it did not work for me, for reasons unknown to me. So I cloned an Ubuntu 23.04 (Lunar Lobster) LXC container and built the MariaDB server in it.
To make the whole thing work, however, the package sources had to be added to the file /etc/apt/sources.list in the container first:
deb-src http://de.archive.ubuntu.com/ubuntu lunar main restricted universe multiverse
deb-src http://de.archive.ubuntu.com/ubuntu lunar-updates main restricted universe multiverse
deb-src http://de.archive.ubuntu.com/ubuntu lunar-security main restricted universe multiverse
deb-src http://de.archive.ubuntu.com/ubuntu lunar-backports main restricted universe multiverse
Then we proceeded according to the instructions:
shell > apt install build-essential bison
shell > apt build-dep mariadb-server
The corresponding branch was cloned:
shell > # git clone https://github.com/andremralves/server.git mariadb-MDEV-33782
shell > # git branch --all
shell > git clone --branch MDEV-33782 --single-branch https://github.com/andremralves/server.git mariadb-MDEV-33782
shell > cd mariadb-MDEV-33782
shell > # git checkout 11.5
and then the server was build. This took about 20 minutes on my old machine. CMake still ran into an error, which was solved by installing the corresponding package (MDEV-33815):
shell > apt install libgnutls28-dev
shell > cmake . -DBUILD_CONFIG=mysql_release && make -j8
The tests were executed:
shell > cd mysql-test
shell > ./mtr rpl.rpl_create_drop_event
Logging: ./mtr rpl.rpl_create_drop_event
VS config:
vardir: /root/mariadb-MDEV-33782/mysql-test/var
Checking leftover processes...
Removing old var directory...
Creating var directory \'/root/mariadb-MDEV-33782/mysql-test/var\'...
Checking supported features...
MariaDB Version 11.5.0-MariaDB
- SSL connections supported
- binaries built with wsrep patch
Collecting tests...
Installing system database...
==============================================================================
TEST RESULT TIME (ms) or COMMENT
--------------------------------------------------------------------------
worker[01] Using MTR_BUILD_THREAD 300, with reserved ports 16000..16019
worker[01] mysql-test-run: WARNING: running this script as _root_ will cause some tests to be skipped
rpl.rpl_create_drop_event \'mix\' [ pass ] 522
rpl.rpl_create_drop_event \'row\' [ pass ] 525
rpl.rpl_create_drop_event \'stmt\' [ pass ] 525
--------------------------------------------------------------------------
The servers were restarted 2 times
Spent 1.572 of 14 seconds executing testcases
Completed: All 3 tests were successful.
And then a binary tarball was build for further testing.
shell > make package
Run CPack packaging tool...
CPack: Create package using TGZ
CPack: Install projects
CPack: - Run preinstall target for: MariaDB
CPack: - Install project: MariaDB []
CPack: Create package
CPack: - package: /root/mariadb-MDEV-33782/mariadb-11.5.0-linux-x86_64.tar.gz generated.
Taxonomy upgrade extras: mariadbbuildcompilingsourcestarball
The post Building MariaDB Server from the sources appeared first on MariaDB.org.
]]>Recently I had to test a new MariaDB feature that was developed at our request (MDEV-33782). To test this feature I had to build the MariaDB server myself from source, which I have not done for a long time. So a new challenge, especially with CMake…
I followed the MariaDB documentation Get, Build and Test Latest MariaDB the Lazy Way to build the server.
On Ubuntu 22.04 it did not work for me, for reasons unknown to me. So I cloned an Ubuntu 23.04 (Lunar Lobster) LXC container and built the MariaDB server in it.
To make the whole thing work, however, the package sources had to be added to the file /etc/apt/sources.list in the container first:
deb-src http://de.archive.ubuntu.com/ubuntu lunar main restricted universe multiverse deb-src http://de.archive.ubuntu.com/ubuntu lunar-updates main restricted universe multiverse deb-src http://de.archive.ubuntu.com/ubuntu lunar-security main restricted universe multiverse deb-src http://de.archive.ubuntu.com/ubuntu lunar-backports main restricted universe multiverse
Then we proceeded according to the instructions:
shell> apt install build-essential bison
shell> apt build-dep mariadb-server
The corresponding branch was cloned:
shell> # git clone https://github.com/andremralves/server.git mariadb-MDEV-33782
shell> # git branch --all
shell> git clone --branch MDEV-33782 --single-branch https://github.com/andremralves/server.git mariadb-MDEV-33782
shell> cd mariadb-MDEV-33782
shell> # git checkout 11.5
and then the server was build. This took about 20 minutes on my old machine. CMake still ran into an error, which was solved by installing the corresponding package (MDEV-33815):
shell> apt install libgnutls28-dev
shell> cmake . -DBUILD_CONFIG=mysql_release && make -j8
The tests were executed:
shell> cd mysql-test
shell> ./mtr rpl.rpl_create_drop_event
Logging: ./mtr  rpl.rpl_create_drop_event
VS config:
vardir: /root/mariadb-MDEV-33782/mysql-test/var
Checking leftover processes...
Removing old var directory...
Creating var directory '/root/mariadb-MDEV-33782/mysql-test/var'...
Checking supported features...
MariaDB Version 11.5.0-MariaDB
 - SSL connections supported
 - binaries built with wsrep patch
Collecting tests...
Installing system database...

==============================================================================

TEST                                      RESULT   TIME (ms) or COMMENT
--------------------------------------------------------------------------

worker[01] Using MTR_BUILD_THREAD 300, with reserved ports 16000..16019
worker[01] mysql-test-run: WARNING: running this script as _root_ will cause some tests to be skipped
rpl.rpl_create_drop_event 'mix'          [ pass ]    522
rpl.rpl_create_drop_event 'row'          [ pass ]    525
rpl.rpl_create_drop_event 'stmt'         [ pass ]    525
--------------------------------------------------------------------------
The servers were restarted 2 times
Spent 1.572 of 14 seconds executing testcases

Completed: All 3 tests were successful.
And then a binary tarball was build for further testing.
shell> make package
Run CPack packaging tool...
CPack: Create package using TGZ
CPack: Install projects
CPack: - Run preinstall target for: MariaDB
CPack: - Install project: MariaDB []
CPack: Create package
CPack: - package: /root/mariadb-MDEV-33782/mariadb-11.5.0-linux-x86_64.tar.gz generated.
The post Building MariaDB Server from the sources appeared first on MariaDB.org.
]]>I followed the MariaDB documentation Get, Build and Test Latest MariaDB the Lazy Way to build the server.
On Ubuntu 22.04 it did not work for me, for reasons unknown to me. So I cloned an Ubuntu 23.04 (Lunar Lobster) LXC container and built the MariaDB server in it.
To make the whole thing work, however, the package sources had to be added to the file /etc/apt/sources.list in the container first:
deb-src http://de.archive.ubuntu.com/ubuntu lunar main restricted universe multiverse
deb-src http://de.archive.ubuntu.com/ubuntu lunar-updates main restricted universe multiverse
deb-src http://de.archive.ubuntu.com/ubuntu lunar-security main restricted universe multiverse
deb-src http://de.archive.ubuntu.com/ubuntu lunar-backports main restricted universe multiverse
Then we proceeded according to the instructions:
shell > apt install build-essential bison
shell > apt build-dep mariadb-server
The corresponding branch was cloned:
shell > # git clone https://github.com/andremralves/server.git mariadb-MDEV-33782
shell > # git branch --all
shell > git clone --branch MDEV-33782 --single-branch https://github.com/andremralves/server.git mariadb-MDEV-33782
shell > cd mariadb-MDEV-33782
shell > # git checkout 11.5
and then the server was build. This took about 20 minutes on my old machine. CMake still ran into an error, which was solved by installing the corresponding package (MDEV-33815):
shell > apt install libgnutls28-dev
shell > cmake . -DBUILD_CONFIG=mysql_release && make -j8
The tests were executed:
shell > cd mysql-test
shell > ./mtr rpl.rpl_create_drop_event
Logging: ./mtr rpl.rpl_create_drop_event
VS config:
vardir: /root/mariadb-MDEV-33782/mysql-test/var
Checking leftover processes...
Removing old var directory...
Creating var directory \'/root/mariadb-MDEV-33782/mysql-test/var\'...
Checking supported features...
MariaDB Version 11.5.0-MariaDB
- SSL connections supported
- binaries built with wsrep patch
Collecting tests...
Installing system database...
==============================================================================
TEST RESULT TIME (ms) or COMMENT
--------------------------------------------------------------------------
worker[01] Using MTR_BUILD_THREAD 300, with reserved ports 16000..16019
worker[01] mysql-test-run: WARNING: running this script as _root_ will cause some tests to be skipped
rpl.rpl_create_drop_event \'mix\' [ pass ] 522
rpl.rpl_create_drop_event \'row\' [ pass ] 525
rpl.rpl_create_drop_event \'stmt\' [ pass ] 525
--------------------------------------------------------------------------
The servers were restarted 2 times
Spent 1.572 of 14 seconds executing testcases
Completed: All 3 tests were successful.
And then a binary tarball was build for further testing.
shell > make package
Run CPack packaging tool...
CPack: Create package using TGZ
CPack: Install projects
CPack: - Run preinstall target for: MariaDB
CPack: - Install project: MariaDB []
CPack: Create package
CPack: - package: /root/mariadb-MDEV-33782/mariadb-11.5.0-linux-x86_64.tar.gz generated.
Taxonomy upgrade extras: mariadbbuildcompilingsourcestarball
The post Shinguz: Building MariaDB Server from the sources appeared first on MariaDB.org.
]]>Recently I had to test a new MariaDB feature that was developed at our request (MDEV-33782). To test this feature I had to build the MariaDB server myself from source, which I have not done for a long time. So a new challenge, especially with CMake…
I followed the MariaDB documentation Get, Build and Test Latest MariaDB the Lazy Way to build the server.
On Ubuntu 22.04 it did not work for me, for reasons unknown to me. So I cloned an Ubuntu 23.04 (Lunar Lobster) LXC container and built the MariaDB server in it.
To make the whole thing work, however, the package sources had to be added to the file /etc/apt/sources.list in the container first:
deb-src http://de.archive.ubuntu.com/ubuntu lunar main restricted universe multiverse deb-src http://de.archive.ubuntu.com/ubuntu lunar-updates main restricted universe multiverse deb-src http://de.archive.ubuntu.com/ubuntu lunar-security main restricted universe multiverse deb-src http://de.archive.ubuntu.com/ubuntu lunar-backports main restricted universe multiverse
Then we proceeded according to the instructions:
shell> apt install build-essential bison
shell> apt build-dep mariadb-server
The corresponding branch was cloned:
shell> # git clone https://github.com/andremralves/server.git mariadb-MDEV-33782
shell> # git branch --all
shell> git clone --branch MDEV-33782 --single-branch https://github.com/andremralves/server.git mariadb-MDEV-33782
shell> cd mariadb-MDEV-33782
shell> # git checkout 11.5
and then the server was build. This took about 20 minutes on my old machine. CMake still ran into an error, which was solved by installing the corresponding package (MDEV-33815):
shell> apt install libgnutls28-dev
shell> cmake . -DBUILD_CONFIG=mysql_release && make -j8
The tests were executed:
shell> cd mysql-test
shell> ./mtr rpl.rpl_create_drop_event
Logging: ./mtr  rpl.rpl_create_drop_event
VS config:
vardir: /root/mariadb-MDEV-33782/mysql-test/var
Checking leftover processes...
Removing old var directory...
Creating var directory '/root/mariadb-MDEV-33782/mysql-test/var'...
Checking supported features...
MariaDB Version 11.5.0-MariaDB
 - SSL connections supported
 - binaries built with wsrep patch
Collecting tests...
Installing system database...

==============================================================================

TEST                                      RESULT   TIME (ms) or COMMENT
--------------------------------------------------------------------------

worker[01] Using MTR_BUILD_THREAD 300, with reserved ports 16000..16019
worker[01] mysql-test-run: WARNING: running this script as _root_ will cause some tests to be skipped
rpl.rpl_create_drop_event 'mix'          [ pass ]    522
rpl.rpl_create_drop_event 'row'          [ pass ]    525
rpl.rpl_create_drop_event 'stmt'         [ pass ]    525
--------------------------------------------------------------------------
The servers were restarted 2 times
Spent 1.572 of 14 seconds executing testcases

Completed: All 3 tests were successful.
And then a binary tarball was build for further testing.
shell> make package
Run CPack packaging tool...
CPack: Create package using TGZ
CPack: Install projects
CPack: - Run preinstall target for: MariaDB
CPack: - Install project: MariaDB []
CPack: Create package
CPack: - package: /root/mariadb-MDEV-33782/mariadb-11.5.0-linux-x86_64.tar.gz generated.
The post Shinguz: Building MariaDB Server from the sources appeared first on MariaDB.org.
]]>The post dbdeployer Tutorial on Mac appeared first on MariaDB.org.
]]>The post dbdeployer Tutorial on Mac appeared first on MariaDB.org.
]]>The post Sysbench on a small server: MariaDB and MySQL appeared first on MariaDB.org.
]]>This work was done by Small Datum LLC and sponsored by the MariaDB Foundation.
My standard disclaimer is that sysbench with low-concurrency is great for spotting CPU regressions. However, a result with higher concurrency from a larger server is also needed to understand things. Results from IO-bound workloads and less synthetic workloads are also needed. But low-concurrency, cached sysbench is a great place to start.
tl;dr
For MySQL I used 5.6.51, 5.7.44 and 8.0.36.
The first GA release for MariaDB 10.2 was in 2017. The first GA release for MySQL 5.6 was in 2013. So while I cannot claim that my testing covers MySQL and MariaDB from the same time period, I can claim that I am testing old versions of both.
Everything was compiled from source with similar CMake command lines and CMAKE_BUILD_TYPE set to Release. It is much easier to compile older MariaDB releases than older MySQL releases. For MariaDB I did not have to edit any source files. Notes on compiling MySQL are here for 5.6, for 5.6 and 5.7, for 5.7 and for 8.0. A note on using cmake is here.
The benchmark is run with:


The post Sysbench on a small server: MariaDB and MySQL appeared first on MariaDB.org.
]]>The post ClusterControl Terraform provider now available appeared first on MariaDB.org.
]]>With our Terraform Provider, users can build provisioning workflows into the deployment sequences of their ClusterControl-managed databases.
For DevOps teams using ClusterControl and Terraform, this will further reduce the daily operational load and complexity by helping to streamline processes.
Additional capabilities include adding nodes (replication secondary), deploying ProxySQL, scheduling backups, setting maintenance, and enabling PBM, and PgBackRest. To get started, check out our Terraform documentation.
With ClusterControl integrating with Terraform, users can now run provisioning and other database lifecycle ops more efficiently. Stay tuned for upcoming updates as we enhance our Terraform capabilities, including support for additional databases, load balancers, scaling of nodes, and more exciting features!
New to ClusterControl? Experience our Enterprise edition free for 30 days and receive dedicated technical support to assist you every step of the way.
The post ClusterControl Terraform provider now available appeared first on Severalnines.
The post ClusterControl Terraform provider now available appeared first on MariaDB.org.
]]> Overview
Preparations
Activate MaxScale configuration synchronisation
Change MaxScale parameters
Add new slave and make MaxScale known
Remove old slave and make MaxScale known
How is the configuration synchronised?
What happens in the event of a conflict?
Tests
Deactivating MaxScale configuration synchronisation again
Literature/sources
Overview
A feature that I recently discovered while browsing is the MaxScale configuration synchronisation functionality.
This is not primarily about a MariaDB replication cluster or a MariaDB Galera cluster, but about a cluster consisting of two or more MaxScale nodes. Or more precisely, the exchange of the configuration between these MaxScale nodes.
Pon Suresh Pandian has already written a blog article about this feature in 2022, which is even more detailed than this post here.
Preparations
An LXD container environment was prepared, consisting of 3 database containers (deb12-n1 (10.139.158.33), deb12-n2 (10.139.158.178), deb12-n3 (10.139.158.39)) and 2 MaxScale containers (deb12-mxs1 (10.139.158.66), deb12-mxs2 (10.139.158.174)). The database version is a MariaDB 10.11.6 from the Debian repository and MaxScale was downloaded in version 22.08.5 from the MariaDB plc website.
The database configuration looks similar for all 3 nodes:
#
# /etc/mysql/mariadb.conf.d/99-fromdual.cnf
#

[server]

server_id               = 1
log_bin                 = deb12-n1-binlog
binlog_format           = row
bind_address            = *
proxy_protocol_networks = ::1, 10.139.158.0/24, localhost
gtid_strict_mode        = on
log_slave_updates       = on
skip_name_resolve       = on
The MaxScale nodes were built as described in the article Sharding with MariaDB MaxScale.
The maxscale_admin user has exactly the same rights as described there, the maxscale_monitor user has the following rights:
RELOAD, SUPER, REPLICATION SLAVE, READ_ONLY ADMIN
See also here: Required Grants.
The MaxScale start configuration looks like this:
#
# /etc/maxscale.cnf
#

[maxscale]
threads                      = auto
admin_gui                    = false

[deb12-n1]
type                         = server
address                      = 10.139.158.33
port                         = 3306
proxy_protocol               = true

[deb12-n2]
type                         = server
address                      = 10.139.158.178
port                         = 3306
proxy_protocol               = true

[Replication-Monitor]
type                         = monitor
module                       = mariadbmon
servers                      = deb12-n1,deb12-n2
user                         = maxscale_monitor
password                     = secret
monitor_interval             = 500ms
auto_failover                = true
auto_rejoin                  = true
enforce_read_only_slaves     = true
replication_user             = replication
replication_password         = secret
cooperative_monitoring_locks = majority_of_running

[WriteListener]
type                         = listener
service                      = WriteService
port                         = 3306

[WriteService]
type                         = service
router                       = readwritesplit
servers                      = deb12-n1,deb12-n2
user                         = maxscale_admin
password                     = secret
transaction_replay           = true
transaction_replay_timeout   = 30s
Important: The configuration should look the same on all MaxScale nodes!
And then a few more checks were done to be sure that everything is correct:
shell > maxctrl list listeners
┌───────────────┬──────┬──────┬─────────┬──────────────┐
│ Name │ Port │ Host │ State │ Service │
├───────────────┼──────┼──────┼─────────┼──────────────┤
│ WriteListener │ 3306 │ :: │ Running │ WriteService │
└───────────────┴──────┴──────┴─────────┴──────────────┘
shell > maxctrl list services
┌──────────────┬────────────────┬─────────────┬───────────────────┬────────────────────┐
│ Service │ Router │ Connections │ Total Connections │ Targets │
├──────────────┼────────────────┼─────────────┼───────────────────┼────────────────────┤
│ WriteService │ readwritesplit │ 0 │ 0 │ deb12-n1, deb12-n2 │
└──────────────┴────────────────┴─────────────┴───────────────────┴────────────────────┘
shell > maxctrl list servers
┌──────────┬────────────────┬──────┬─────────────┬─────────────────┬────────┬─────────────────────┐
│ Server │ Address │ Port │ Connections │ State │ GTID │ Monitor │
├──────────┼────────────────┼──────┼─────────────┼─────────────────┼────────┼─────────────────────┤
│ deb12-n1 │ 10.139.158.33 │ 3306 │ 0 │ Master, Running │ 0-1-19 │ Replication-Monitor │
├──────────┼────────────────┼──────┼─────────────┼─────────────────┼────────┼─────────────────────┤
│ deb12-n2 │ 10.139.158.178 │ 3306 │ 0 │ Slave, Running │ 0-1-19 │ Replication-Monitor │
└──────────┴────────────────┴──────┴─────────────┴─────────────────┴────────┴─────────────────────┘
SQL > SELECT @@hostname, test.* FROM test.test;
+------------+----+-----------+---------------------+
| @@hostname | id | data | ts |
+------------+----+-----------+---------------------+
| deb12-n2 | 1 | Some data | 2024-03-26 09:40:21 |
+------------+----+-----------+---------------------+
SQL > SELECT @@hostname, test.* FROM test.test FOR UPDATE;
+------------+----+-----------+---------------------+
| @@hostname | id | data | ts |
+------------+----+-----------+---------------------+
| deb12-n1 | 1 | Some data | 2024-03-26 09:40:21 |
+------------+----+-----------+---------------------+
And another test whether MaxScale really executes the failover correctly:
shell > systemctl stop mariadb
2024-03-26 16:27:05 error : Monitor was unable to connect to server deb12-n2[10.139.158.178:3306] : \'Can\'t connect to server on \'10.139.158.178\' (115)\'
2024-03-26 16:27:05 notice : Server changed state: deb12-n2[10.139.158.178:3306]: master_down. [Master, Running] - > [Down]
2024-03-26 16:27:05 warning: [mariadbmon] Primary has failed. If primary does not return in 4 monitor tick(s), failover begins.
2024-03-26 16:27:07 notice : [mariadbmon] Selecting a server to promote and replace \'deb12-n2\'. Candidates are: \'deb12-n1\'.
2024-03-26 16:27:07 notice : [mariadbmon] Selected \'deb12-n1\'.
2024-03-26 16:27:07 notice : [mariadbmon] Performing automatic failover to replace failed primary \'deb12-n2\'.
2024-03-26 16:27:07 notice : [mariadbmon] Failover \'deb12-n2\' - > \'deb12-n1\' performed.
2024-03-26 16:27:07 notice : Server changed state: deb12-n1[10.139.158.33:3306]: new_master. [Slave, Running] - > [Master, Running]
shell > systemctl start mariadb
2024-03-26 16:28:03 notice : Server changed state: deb12-n2[10.139.158.178:3306]: server_up. [Down] - > [Running]
2024-03-26 16:28:03 notice : [mariadbmon] Directing standalone server \'deb12-n2\' to replicate from \'deb12-n1\'.
2024-03-26 16:28:03 notice : [mariadbmon] Replica connection from deb12-n2 to [10.139.158.33]:3306 created and started.
2024-03-26 16:28:03 notice : [mariadbmon] 1 server(s) redirected or rejoined the cluster.
2024-03-26 16:28:03 notice : Server changed state: deb12-n2[10.139.158.178:3306]: new_slave. [Running] - > [Slave, Running]
Which MaxScale node is currently responsible for monitoring and failover (cooperatve_monitoring) can be determined as follows:
shell > maxctrl show monitor Replication-Monitor | grep -e \'Diagnostics\' -e \'\"primary\"\' -e \'lock_held\' | uniq
│ Monitor Diagnostics │ { │
│ │ \"primary\": true, │
│ │ \"lock_held\": true, │
It should be ensured that everything works properly up to this point. Otherwise there is no real point in the next steps.
Activate MaxScale configuration synchronisation
A separate database user with the following rights is required for configuration synchronisation:
SQL > CREATE USER \'maxscale_confsync\'@\'%\' IDENTIFIED BY \'secret\';
SQL > GRANT SELECT, INSERT, UPDATE, CREATE ON `mysql`.`maxscale_config` TO maxscale_confsync@\'%\';
MaxScale must then be configured accordingly (on both MaxScale nodes) so that configuration synchronisation is activated. This configuration takes place in the global MaxScale section:
#
# /etc/maxscale.cnf
#
[maxscale]
config_sync_cluster = Replication-Monitor
config_sync_user = maxscale_confsync
config_sync_password = secret
The MaxScale nodes are then restarted:
shell > systemctl restart maxscale
MaxScale configuration synchronisation can also be activated and deactivated dynamically:
shell > maxctrl show maxscale | grep config_sync
│ │ \"config_sync_cluster\": null, │
│ │ \"config_sync_db\": \"mysql\", │
│ │ \"config_sync_interval\": \"5000ms\", │
│ │ \"config_sync_password\": null, │
│ │ \"config_sync_timeout\": \"10000ms\", │
│ │ \"config_sync_user\": null, │
Here it is important to keep to the correct order of the 3 commands, otherwise there will be an error:
shell > MAXCTRL_WARNINGS=0 maxctrl alter maxscale config_sync_user=\'maxscale_confsync\'
shell > MAXCTRL_WARNINGS=0 maxctrl alter maxscale config_sync_password=\'secret\'
shell > MAXCTRL_WARNINGS=0 maxctrl alter maxscale config_sync_cluster=\'Replication-Monitor\'
Change MaxScale parameters
As a first test, we have focussed on the MaxScale monitor variable monitor_interval, which in this case is even different on both MaxScale nodes:
shell > maxctrl show monitor Replication-Monitor | grep monitor_interval
│ │ \"monitor_interval\": \"750ms\",
shell > maxctrl show monitor Replication-Monitor | grep monitor_interval
│ │ \"monitor_interval\": \"1000ms\",
The variable can now be set on a MaxScale node with the alter monitor command:
shell > MAXCTRL_WARNINGS=0 maxctrl alter monitor Replication-Monitor monitor_interval=500ms
OK
which can be seen in the MaxScale error log:
2024-03-26 14:09:16 notice : (ConfigManager); Updating to configuration version 1
On the other hand, the value should be propagated to the second MaxScale node within 5 seconds (config_sync_interval), which can be checked with the above command.
Add new slave and make MaxScale known
A new slave (deb12-n3) is first created and added to the MariaDB replication cluster by hand. The slave is then made known to a MaxScale node:
shell > maxctrl create server deb12-n3 10.139.158.39
shell > MAXCTRL_WARNINGS=0 maxctrl link monitor Replication-Monitor deb12-n3
OK
shell > MAXCTRL_WARNINGS=0 maxctrl link service WriteService deb12-n3
OK
shell > maxctrl list servers
┌──────────┬────────────────┬──────┬─────────────┬─────────────────┬────────────┬─────────────────────┐
│ Server │ Address │ Port │ Connections │ State │ GTID │ Monitor │
├──────────┼────────────────┼──────┼─────────────┼─────────────────┼────────────┼─────────────────────┤
│ deb12-n1 │ 10.139.158.33 │ 3306 │ 3 │ Slave, Running │ 0-2-479618 │ Replication-Monitor │
├──────────┼────────────────┼──────┼─────────────┼─────────────────┼────────────┼─────────────────────┤
│ deb12-n2 │ 10.139.158.178 │ 3306 │ 3 │ Master, Running │ 0-2-479618 │ Replication-Monitor │
├──────────┼────────────────┼──────┼─────────────┼─────────────────┼────────────┼─────────────────────┤
│ deb12-n3 │ 10.139.158.39 │ 3306 │ 1 │ Slave, Running │ 0-2-479618 │ Replication-Monitor │
└──────────┴────────────────┴──────┴─────────────┴─────────────────┴────────────┴─────────────────────┘
Remove old slave and make MaxScale known
Before a slave can be deleted, it should be removed from the replication cluster for a MaxScale node:
shell > maxctrl destroy server deb12-n1 --force
OK
shell > maxctrl list servers
┌──────────┬────────────────┬──────┬─────────────┬─────────────────┬────────────┬─────────────────────┐
│ Server │ Address │ Port │ Connections │ State │ GTID │ Monitor │
├──────────┼────────────────┼──────┼─────────────┼─────────────────┼────────────┼─────────────────────┤
│ deb12-n2 │ 10.139.158.178 │ 3306 │ 3 │ Master, Running │ 0-2-493034 │ Replication-Monitor │
├──────────┼────────────────┼──────┼─────────────┼─────────────────┼────────────┼─────────────────────┤
│ deb12-n3 │ 10.139.158.39 │ 3306 │ 1 │ Slave, Running │ 0-2-493032 │ Replication-Monitor │
└──────────┴────────────────┴──────┴─────────────┴─────────────────┴────────────┴─────────────────────┘
The slave can then be removed.
How is the configuration synchronised?
The configuration of the two MaxScale nodes is synchronised via the database, which I personally consider to be an unfortunate design decision, as a configuration change could potentially cause chaos if the master breaks or network problems occur between the database nodes...
The configuration is stored in the table mysql.maxscale_config, which looks like this:
CREATE TABLE `maxscale_config` (
`cluster` varchar(256) NOT NULL,
`version` bigint(20) NOT NULL,
`config` longtext CHARACTER SET utf8mb4 COLLATE utf8mb4_bin NOT NULL CHECK (json_valid(`config`)),
`origin` varchar(254) NOT NULL,
`nodes` longtext CHARACTER SET utf8mb4 COLLATE utf8mb4_bin NOT NULL CHECK (json_valid(`nodes`)),
PRIMARY KEY (`cluster`)
) ENGINE=InnoDB DEFAULT CHARSET=utf8mb4 COLLATE=utf8mb4_general_ci
This table has approximately the following content:
SQL > SELECT cluster, version, CONCAT(SUBSTR(config, 1, 32), \' ... \', SUBSTR(config, -32)) AS config , origin, nodes FROM mysql.maxscale_config;
+---------------------+---------+-----------------------------------------------------------------------+------------+------------------------------------------+
| cluster | version | config | origin | nodes |
+---------------------+---------+-----------------------------------------------------------------------+------------+------------------------------------------+
| Replication-Monitor | 2 | {\"config\":[{\"id\":\"deb12-n1\",\"typ ... ter_name\":\"Replication-Monitor\"} | deb12-mxs1 | {\"deb12-mxs1\": \"OK\", \"deb12-mxs2\": \"OK\"} |
+---------------------+---------+-----------------------------------------------------------------------+------------+------------------------------------------+
A local copy is available on each node for security reasons:
shell > cut -b-32 /var/lib/maxscale/maxscale-config.json
{\"config\":[{\"id\":\"deb12-n2\",\"typ
What happens in the event of a conflict?
See also: Error Handling in Configuration Synchronization
If the configuration is changed simultaneously (within config_sync_interval?) on two different MaxScale nodes, we receive the following error message:
Error: Server at http://127.0.0.1:8989 responded with 400 Bad Request to `PATCH monitors/Replication-Monitor`
{
\"errors\": [
{
\"detail\": \"Cannot start configuration change: Configuration conflict detected: version stored in the cluster (3) is not the same as the local version (2), MaxScale is out of sync.\"
}
]
}
The following command may help to recognise the problem in the event of major faults:
shell > maxctrl show maxscale | grep -A9 \'Config Sync\'
│ Config Sync │ { │
│ │ \"checksum\": \"0052fe6f775168bf00778abbe37775f6f642adc7\", │
│ │ \"nodes\": { │
│ │ \"deb12-mxs1\": \"OK\", │
│ │ \"deb12-mxs2\": \"OK\" │
│ │ }, │
│ │ \"origin\": \"deb12-mxs2\", │
│ │ \"status\": \"OK\", │
│ │ \"version\": 3 │
│ │ } │
Tests
All tests were also carried out under load. The following tests ran in parallel:
insert_test.php
insert_test.sh
mixed_test.php
while [ true ] ; do mariadb -s --user=app --host=10.139.158.174 --port=3306 --password=secret --execute=\'SELECT @@hostname, COUNT(*) FROM test.test GROUP BY @@hostname\' ; sleep 0.5 ; done
while [ true ] ; do mariadb -s --user=app --host=10.139.158.174 --port=3306 --password=secret --execute=\'SELECT @@hostname, COUNT(*) FROM test.test GROUP BY @@hostname FOR UPDATE\' ; sleep 0.5 ; done
All tests have run flawlessly and without problems with all manipulations.
Deactivate MaxScale configuration synchronisation again
Execute the following command on both MaxScale nodes to end configuration synchronisation:
shell > MAXCTRL_WARNINGS=0 maxctrl alter maxscale config_sync_cluster=\'\'
Literature/sources
MaxScale globale Konfigurationsvariable: config_sync_cluster
MaxScale Configuration Synchronization
Pon Suresh Pandian, MariaDB, 24. August 2022: MariaDB MaxScale 6.0 Native Clustering
Where to get maxscale 6 mysql.maxscale_config table source sql
Setting up MariaDB MaxScale
Configuring the MariaDB Monitor
MariaDB MaxScale Load Balancer with Master/Master Replication
MariaDB Monitor - Configuration
Taxonomy upgrade extras: maxscaleconfigurationclusterload balancer
The post MaxScale configuration synchronisation appeared first on MariaDB.org.
]]>A feature that I recently discovered while browsing is the MaxScale configuration synchronisation functionality.
This is not primarily about a MariaDB replication cluster or a MariaDB Galera cluster, but about a cluster consisting of two or more MaxScale nodes. Or more precisely, the exchange of the configuration between these MaxScale nodes.

Pon Suresh Pandian has already written a blog article about this feature in 2022, which is even more detailed than this post here.
An LXD container environment was prepared, consisting of 3 database containers (deb12-n1 (10.139.158.33), deb12-n2 (10.139.158.178), deb12-n3 (10.139.158.39)) and 2 MaxScale containers (deb12-mxs1 (10.139.158.66), deb12-mxs2 (10.139.158.174)). The database version is a MariaDB 10.11.6 from the Debian repository and MaxScale was downloaded in version 22.08.5 from the MariaDB plc website.
The database configuration looks similar for all 3 nodes:
# # /etc/mysql/mariadb.conf.d/99-fromdual.cnf # [server] server_id = 1 log_bin = deb12-n1-binlog binlog_format = row bind_address = * proxy_protocol_networks = ::1, 10.139.158.0/24, localhost gtid_strict_mode = on log_slave_updates = on skip_name_resolve = on
The MaxScale nodes were built as described in the article Sharding with MariaDB MaxScale.
The maxscale_admin user has exactly the same rights as described there, the maxscale_monitor user has the following rights:
RELOAD, SUPER, REPLICATION SLAVE, READ_ONLY ADMIN
See also here: Required Grants.
The MaxScale start configuration looks like this:
# # /etc/maxscale.cnf # [maxscale] threads = auto admin_gui = false [deb12-n1] type = server address = 10.139.158.33 port = 3306 proxy_protocol = true [deb12-n2] type = server address = 10.139.158.178 port = 3306 proxy_protocol = true [Replication-Monitor] type = monitor module = mariadbmon servers = deb12-n1,deb12-n2 user = maxscale_monitor password = secret monitor_interval = 500ms auto_failover = true auto_rejoin = true enforce_read_only_slaves = true replication_user = replication replication_password = secret cooperative_monitoring_locks = majority_of_running [WriteListener] type = listener service = WriteService port = 3306 [WriteService] type = service router = readwritesplit servers = deb12-n1,deb12-n2 user = maxscale_admin password = secret transaction_replay = true transaction_replay_timeout = 30s
Important: The configuration should look the same on all MaxScale nodes!
And then a few more checks were done to be sure that everything is correct:
shell> maxctrl list listeners
┌───────────────┬──────┬──────┬─────────┬──────────────┐
│ Name          │ Port │ Host │ State   │ Service      │
├───────────────┼──────┼──────┼─────────┼──────────────┤
│ WriteListener │ 3306 │ ::   │ Running │ WriteService │
└───────────────┴──────┴──────┴─────────┴──────────────┘

shell> maxctrl list services
┌──────────────┬────────────────┬─────────────┬───────────────────┬────────────────────┐
│ Service      │ Router         │ Connections │ Total Connections │ Targets            │
├──────────────┼────────────────┼─────────────┼───────────────────┼────────────────────┤
│ WriteService │ readwritesplit │ 0           │ 0                 │ deb12-n1, deb12-n2 │
└──────────────┴────────────────┴─────────────┴───────────────────┴────────────────────┘

shell> maxctrl list servers
┌──────────┬────────────────┬──────┬─────────────┬─────────────────┬────────┬─────────────────────┐
│ Server   │ Address        │ Port │ Connections │ State           │ GTID   │ Monitor             │
├──────────┼────────────────┼──────┼─────────────┼─────────────────┼────────┼─────────────────────┤
│ deb12-n1 │ 10.139.158.33  │ 3306 │ 0           │ Master, Running │ 0-1-19 │ Replication-Monitor │
├──────────┼────────────────┼──────┼─────────────┼─────────────────┼────────┼─────────────────────┤
│ deb12-n2 │ 10.139.158.178 │ 3306 │ 0           │ Slave, Running  │ 0-1-19 │ Replication-Monitor │
└──────────┴────────────────┴──────┴─────────────┴─────────────────┴────────┴─────────────────────┘

SQL> SELECT @@hostname, test.* FROM test.test;
+------------+----+-----------+---------------------+
| @@hostname | id | data      | ts                  |
+------------+----+-----------+---------------------+
| deb12-n2   |  1 | Some data | 2024-03-26 09:40:21 |
+------------+----+-----------+---------------------+

SQL> SELECT @@hostname, test.* FROM test.test FOR UPDATE;
+------------+----+-----------+---------------------+
| @@hostname | id | data      | ts                  |
+------------+----+-----------+---------------------+
| deb12-n1   |  1 | Some data | 2024-03-26 09:40:21 |
+------------+----+-----------+---------------------+
And another test whether MaxScale really executes the failover correctly:
shell> systemctl stop mariadb
2024-03-26 16:27:05   error  : Monitor was unable to connect to server deb12-n2[10.139.158.178:3306] : 'Can't connect to server on '10.139.158.178' (115)'
2024-03-26 16:27:05   notice : Server changed state: deb12-n2[10.139.158.178:3306]: master_down. [Master, Running] -> [Down]
2024-03-26 16:27:05   warning: [mariadbmon] Primary has failed. If primary does not return in 4 monitor tick(s), failover begins.
2024-03-26 16:27:07   notice : [mariadbmon] Selecting a server to promote and replace 'deb12-n2'. Candidates are: 'deb12-n1'.
2024-03-26 16:27:07   notice : [mariadbmon] Selected 'deb12-n1'.
2024-03-26 16:27:07   notice : [mariadbmon] Performing automatic failover to replace failed primary 'deb12-n2'.
2024-03-26 16:27:07   notice : [mariadbmon] Failover 'deb12-n2' -> 'deb12-n1' performed.
2024-03-26 16:27:07   notice : Server changed state: deb12-n1[10.139.158.33:3306]: new_master. [Slave, Running] -> [Master, Running]

shell> systemctl start mariadb
2024-03-26 16:28:03   notice : Server changed state: deb12-n2[10.139.158.178:3306]: server_up. [Down] -> [Running]
2024-03-26 16:28:03   notice : [mariadbmon] Directing standalone server 'deb12-n2' to replicate from 'deb12-n1'.
2024-03-26 16:28:03   notice : [mariadbmon] Replica connection from deb12-n2 to [10.139.158.33]:3306 created and started.
2024-03-26 16:28:03   notice : [mariadbmon] 1 server(s) redirected or rejoined the cluster.
2024-03-26 16:28:03   notice : Server changed state: deb12-n2[10.139.158.178:3306]: new_slave. [Running] -> [Slave, Running]
Which MaxScale node is currently responsible for monitoring and failover (cooperatve_monitoring) can be determined as follows:
shell> maxctrl show monitor Replication-Monitor | grep -e 'Diagnostics' -e '"primary"' -e 'lock_held' | uniq
│ Monitor Diagnostics │ {                                                                                                                                                                                                                      │
│                     │     "primary": true,                                                                                                                                                                                                   │
│                     │             "lock_held": true,                                                                                                                                                                                         │
It should be ensured that everything works properly up to this point. Otherwise there is no real point in the next steps.
A separate database user with the following rights is required for configuration synchronisation:
SQL> CREATE USER 'maxscale_confsync'@'%' IDENTIFIED BY 'secret';
SQL> GRANT SELECT, INSERT, UPDATE, CREATE ON `mysql`.`maxscale_config` TO maxscale_confsync@'%';
MaxScale must then be configured accordingly (on both MaxScale nodes) so that configuration synchronisation is activated. This configuration takes place in the global MaxScale section:
#
# /etc/maxscale.cnf
#

[maxscale]
config_sync_cluster  = Replication-Monitor
config_sync_user     = maxscale_confsync
config_sync_password = secret
The MaxScale nodes are then restarted:
shell> systemctl restart maxscale
MaxScale configuration synchronisation can also be activated and deactivated dynamically:
shell> maxctrl show maxscale | grep config_sync
│              │     "config_sync_cluster": null,                                        │
│              │     "config_sync_db": "mysql",                                          │
│              │     "config_sync_interval": "5000ms",                                   │
│              │     "config_sync_password": null,                                       │
│              │     "config_sync_timeout": "10000ms",                                   │
│              │     "config_sync_user": null,                                           │
Here it is important to keep to the correct order of the 3 commands, otherwise there will be an error:
shell> MAXCTRL_WARNINGS=0 maxctrl alter maxscale config_sync_user='maxscale_confsync'
shell> MAXCTRL_WARNINGS=0 maxctrl alter maxscale config_sync_password='secret'
shell> MAXCTRL_WARNINGS=0 maxctrl alter maxscale config_sync_cluster='Replication-Monitor'
As a first test, we have focussed on the MaxScale monitor variable monitor_interval, which in this case is even different on both MaxScale nodes:
shell>  maxctrl show monitor Replication-Monitor | grep monitor_interval
│                     │     "monitor_interval": "750ms",

shell> maxctrl show monitor Replication-Monitor | grep monitor_interval
│                     │     "monitor_interval": "1000ms",
The variable can now be set on a MaxScale node with the alter monitor command:
shell> MAXCTRL_WARNINGS=0 maxctrl alter monitor Replication-Monitor monitor_interval=500ms
OK
which can be seen in the MaxScale error log:
2024-03-26 14:09:16 notice : (ConfigManager); Updating to configuration version 1
On the other hand, the value should be propagated to the second MaxScale node within 5 seconds (config_sync_interval), which can be checked with the above command.
A new slave (deb12-n3) is first created and added to the MariaDB replication cluster by hand. The slave is then made known to a MaxScale node:
shell> maxctrl create server deb12-n3 10.139.158.39

shell> MAXCTRL_WARNINGS=0 maxctrl link monitor Replication-Monitor deb12-n3
OK

shell> MAXCTRL_WARNINGS=0 maxctrl link service WriteService deb12-n3
OK

shell> maxctrl list servers
┌──────────┬────────────────┬──────┬─────────────┬─────────────────┬────────────┬─────────────────────┐
│ Server   │ Address        │ Port │ Connections │ State           │ GTID       │ Monitor             │
├──────────┼────────────────┼──────┼─────────────┼─────────────────┼────────────┼─────────────────────┤
│ deb12-n1 │ 10.139.158.33  │ 3306 │ 3           │ Slave, Running  │ 0-2-479618 │ Replication-Monitor │
├──────────┼────────────────┼──────┼─────────────┼─────────────────┼────────────┼─────────────────────┤
│ deb12-n2 │ 10.139.158.178 │ 3306 │ 3           │ Master, Running │ 0-2-479618 │ Replication-Monitor │
├──────────┼────────────────┼──────┼─────────────┼─────────────────┼────────────┼─────────────────────┤
│ deb12-n3 │ 10.139.158.39  │ 3306 │ 1           │ Slave, Running  │ 0-2-479618 │ Replication-Monitor │
└──────────┴────────────────┴──────┴─────────────┴─────────────────┴────────────┴─────────────────────┘
Before a slave can be deleted, it should be removed from the replication cluster for a MaxScale node:
shell> maxctrl destroy server deb12-n1 --force
OK

shell> maxctrl list servers
┌──────────┬────────────────┬──────┬─────────────┬─────────────────┬────────────┬─────────────────────┐
│ Server   │ Address        │ Port │ Connections │ State           │ GTID       │ Monitor             │
├──────────┼────────────────┼──────┼─────────────┼─────────────────┼────────────┼─────────────────────┤
│ deb12-n2 │ 10.139.158.178 │ 3306 │ 3           │ Master, Running │ 0-2-493034 │ Replication-Monitor │
├──────────┼────────────────┼──────┼─────────────┼─────────────────┼────────────┼─────────────────────┤
│ deb12-n3 │ 10.139.158.39  │ 3306 │ 1           │ Slave, Running  │ 0-2-493032 │ Replication-Monitor │
└──────────┴────────────────┴──────┴─────────────┴─────────────────┴────────────┴─────────────────────┘
The slave can then be removed.
The configuration of the two MaxScale nodes is synchronised via the database, which I personally consider to be an unfortunate design decision, as a configuration change could potentially cause chaos if the master breaks or network problems occur between the database nodes…
The configuration is stored in the table mysql.maxscale_config, which looks like this:
CREATE TABLE `maxscale_config` (
  `cluster` varchar(256) NOT NULL,
  `version` bigint(20) NOT NULL,
  `config` longtext CHARACTER SET utf8mb4 COLLATE utf8mb4_bin NOT NULL CHECK (json_valid(`config`)),
  `origin` varchar(254) NOT NULL,
  `nodes` longtext CHARACTER SET utf8mb4 COLLATE utf8mb4_bin NOT NULL CHECK (json_valid(`nodes`)),
  PRIMARY KEY (`cluster`)
) ENGINE=InnoDB DEFAULT CHARSET=utf8mb4 COLLATE=utf8mb4_general_ci
This table has approximately the following content:
SQL> SELECT cluster, version, CONCAT(SUBSTR(config, 1, 32), ' ... ', SUBSTR(config, -32)) AS config , origin, nodes FROM mysql.maxscale_config;
+---------------------+---------+-----------------------------------------------------------------------+------------+------------------------------------------+
| cluster             | version | config                                                                | origin     | nodes                                    |
+---------------------+---------+-----------------------------------------------------------------------+------------+------------------------------------------+
| Replication-Monitor |       2 | {"config":[{"id":"deb12-n1","typ ... ter_name":"Replication-Monitor"} | deb12-mxs1 | {"deb12-mxs1": "OK", "deb12-mxs2": "OK"} |
+---------------------+---------+-----------------------------------------------------------------------+------------+------------------------------------------+
A local copy is available on each node for security reasons:
shell> cut -b-32 /var/lib/maxscale/maxscale-config.json
{"config":[{"id":"deb12-n2","typ
See also: Error Handling in Configuration Synchronization
If the configuration is changed simultaneously (within config_sync_interval?) on two different MaxScale nodes, we receive the following error message:
Error: Server at http://127.0.0.1:8989 responded with 400 Bad Request to `PATCH monitors/Replication-Monitor`
{
    "errors": [
        {
            "detail": "Cannot start configuration change: Configuration conflict detected: version stored in the cluster (3) is not the same as the local version (2), MaxScale is out of sync."
        }
    ]
}
The following command may help to recognise the problem in the event of major faults:
shell> maxctrl show maxscale | grep -A9 'Config Sync'
│ Config Sync  │ {                                                                       │
│              │     "checksum": "0052fe6f775168bf00778abbe37775f6f642adc7",             │
│              │     "nodes": {                                                          │
│              │         "deb12-mxs1": "OK",                                             │
│              │         "deb12-mxs2": "OK"                                              │
│              │     },                                                                  │
│              │     "origin": "deb12-mxs2",                                             │
│              │     "status": "OK",                                                     │
│              │     "version": 3                                                        │
│              │ }                                                                       │
All tests were also carried out under load. The following tests ran in parallel:
insert_test.phpinsert_test.shmixed_test.phpwhile [ true ] ; do mariadb -s --user=app --host=10.139.158.174 --port=3306 --password=secret --execute='SELECT @@hostname, COUNT(*) FROM test.test GROUP BY @@hostname' ; sleep 0.5 ; donewhile [ true ] ; do mariadb -s --user=app --host=10.139.158.174 --port=3306 --password=secret --execute='SELECT @@hostname, COUNT(*) FROM test.test GROUP BY @@hostname FOR UPDATE' ; sleep 0.5 ; doneAll tests have run flawlessly and without problems with all manipulations.
Execute the following command on both MaxScale nodes to end configuration synchronisation:
shell> MAXCTRL_WARNINGS=0 maxctrl alter maxscale config_sync_cluster=''
The post MaxScale configuration synchronisation appeared first on MariaDB.org.
]]> Overview
Preparations
Activate MaxScale configuration synchronisation
Change MaxScale parameters
Add new slave and make MaxScale known
Remove old slave and make MaxScale known
How is the configuration synchronised?
What happens in the event of a conflict?
Tests
Deactivating MaxScale configuration synchronisation again
Literature/sources
Overview
A feature that I recently discovered while browsing is the MaxScale configuration synchronisation functionality.
This is not primarily about a MariaDB replication cluster or a MariaDB Galera cluster, but about a cluster consisting of two or more MaxScale nodes. Or more precisely, the exchange of the configuration between these MaxScale nodes.
Pon Suresh Pandian has already written a blog article about this feature in 2022, which is even more detailed than this post here.
Preparations
An LXD container environment was prepared, consisting of 3 database containers (deb12-n1 (10.139.158.33), deb12-n2 (10.139.158.178), deb12-n3 (10.139.158.39)) and 2 MaxScale containers (deb12-mxs1 (10.139.158.66), deb12-mxs2 (10.139.158.174)). The database version is a MariaDB 10.11.6 from the Debian repository and MaxScale was downloaded in version 22.08.5 from the MariaDB plc website.
The database configuration looks similar for all 3 nodes:
#
# /etc/mysql/mariadb.conf.d/99-fromdual.cnf
#

[server]

server_id               = 1
log_bin                 = deb12-n1-binlog
binlog_format           = row
bind_address            = *
proxy_protocol_networks = ::1, 10.139.158.0/24, localhost
gtid_strict_mode        = on
log_slave_updates       = on
skip_name_resolve       = on
The MaxScale nodes were built as described in the article Sharding with MariaDB MaxScale.
The maxscale_admin user has exactly the same rights as described there, the maxscale_monitor user has the following rights:
RELOAD, SUPER, REPLICATION SLAVE, READ_ONLY ADMIN
See also here: Required Grants.
The MaxScale start configuration looks like this:
#
# /etc/maxscale.cnf
#

[maxscale]
threads                      = auto
admin_gui                    = false

[deb12-n1]
type                         = server
address                      = 10.139.158.33
port                         = 3306
proxy_protocol               = true

[deb12-n2]
type                         = server
address                      = 10.139.158.178
port                         = 3306
proxy_protocol               = true

[Replication-Monitor]
type                         = monitor
module                       = mariadbmon
servers                      = deb12-n1,deb12-n2
user                         = maxscale_monitor
password                     = secret
monitor_interval             = 500ms
auto_failover                = true
auto_rejoin                  = true
enforce_read_only_slaves     = true
replication_user             = replication
replication_password         = secret
cooperative_monitoring_locks = majority_of_running

[WriteListener]
type                         = listener
service                      = WriteService
port                         = 3306

[WriteService]
type                         = service
router                       = readwritesplit
servers                      = deb12-n1,deb12-n2
user                         = maxscale_admin
password                     = secret
transaction_replay           = true
transaction_replay_timeout   = 30s
Important: The configuration should look the same on all MaxScale nodes!
And then a few more checks were done to be sure that everything is correct:
shell > maxctrl list listeners
┌───────────────┬──────┬──────┬─────────┬──────────────┐
│ Name │ Port │ Host │ State │ Service │
├───────────────┼──────┼──────┼─────────┼──────────────┤
│ WriteListener │ 3306 │ :: │ Running │ WriteService │
└───────────────┴──────┴──────┴─────────┴──────────────┘
shell > maxctrl list services
┌──────────────┬────────────────┬─────────────┬───────────────────┬────────────────────┐
│ Service │ Router │ Connections │ Total Connections │ Targets │
├──────────────┼────────────────┼─────────────┼───────────────────┼────────────────────┤
│ WriteService │ readwritesplit │ 0 │ 0 │ deb12-n1, deb12-n2 │
└──────────────┴────────────────┴─────────────┴───────────────────┴────────────────────┘
shell > maxctrl list servers
┌──────────┬────────────────┬──────┬─────────────┬─────────────────┬────────┬─────────────────────┐
│ Server │ Address │ Port │ Connections │ State │ GTID │ Monitor │
├──────────┼────────────────┼──────┼─────────────┼─────────────────┼────────┼─────────────────────┤
│ deb12-n1 │ 10.139.158.33 │ 3306 │ 0 │ Master, Running │ 0-1-19 │ Replication-Monitor │
├──────────┼────────────────┼──────┼─────────────┼─────────────────┼────────┼─────────────────────┤
│ deb12-n2 │ 10.139.158.178 │ 3306 │ 0 │ Slave, Running │ 0-1-19 │ Replication-Monitor │
└──────────┴────────────────┴──────┴─────────────┴─────────────────┴────────┴─────────────────────┘
SQL > SELECT @@hostname, test.* FROM test.test;
+------------+----+-----------+---------------------+
| @@hostname | id | data | ts |
+------------+----+-----------+---------------------+
| deb12-n2 | 1 | Some data | 2024-03-26 09:40:21 |
+------------+----+-----------+---------------------+
SQL > SELECT @@hostname, test.* FROM test.test FOR UPDATE;
+------------+----+-----------+---------------------+
| @@hostname | id | data | ts |
+------------+----+-----------+---------------------+
| deb12-n1 | 1 | Some data | 2024-03-26 09:40:21 |
+------------+----+-----------+---------------------+
And another test whether MaxScale really executes the failover correctly:
shell > systemctl stop mariadb
2024-03-26 16:27:05 error : Monitor was unable to connect to server deb12-n2[10.139.158.178:3306] : \'Can\'t connect to server on \'10.139.158.178\' (115)\'
2024-03-26 16:27:05 notice : Server changed state: deb12-n2[10.139.158.178:3306]: master_down. [Master, Running] - > [Down]
2024-03-26 16:27:05 warning: [mariadbmon] Primary has failed. If primary does not return in 4 monitor tick(s), failover begins.
2024-03-26 16:27:07 notice : [mariadbmon] Selecting a server to promote and replace \'deb12-n2\'. Candidates are: \'deb12-n1\'.
2024-03-26 16:27:07 notice : [mariadbmon] Selected \'deb12-n1\'.
2024-03-26 16:27:07 notice : [mariadbmon] Performing automatic failover to replace failed primary \'deb12-n2\'.
2024-03-26 16:27:07 notice : [mariadbmon] Failover \'deb12-n2\' - > \'deb12-n1\' performed.
2024-03-26 16:27:07 notice : Server changed state: deb12-n1[10.139.158.33:3306]: new_master. [Slave, Running] - > [Master, Running]
shell > systemctl start mariadb
2024-03-26 16:28:03 notice : Server changed state: deb12-n2[10.139.158.178:3306]: server_up. [Down] - > [Running]
2024-03-26 16:28:03 notice : [mariadbmon] Directing standalone server \'deb12-n2\' to replicate from \'deb12-n1\'.
2024-03-26 16:28:03 notice : [mariadbmon] Replica connection from deb12-n2 to [10.139.158.33]:3306 created and started.
2024-03-26 16:28:03 notice : [mariadbmon] 1 server(s) redirected or rejoined the cluster.
2024-03-26 16:28:03 notice : Server changed state: deb12-n2[10.139.158.178:3306]: new_slave. [Running] - > [Slave, Running]
Which MaxScale node is currently responsible for monitoring and failover (cooperatve_monitoring) can be determined as follows:
shell > maxctrl show monitor Replication-Monitor | grep -e \'Diagnostics\' -e \'\"primary\"\' -e \'lock_held\' | uniq
│ Monitor Diagnostics │ { │
│ │ \"primary\": true, │
│ │ \"lock_held\": true, │
It should be ensured that everything works properly up to this point. Otherwise there is no real point in the next steps.
Activate MaxScale configuration synchronisation
A separate database user with the following rights is required for configuration synchronisation:
SQL > CREATE USER \'maxscale_confsync\'@\'%\' IDENTIFIED BY \'secret\';
SQL > GRANT SELECT, INSERT, UPDATE, CREATE ON `mysql`.`maxscale_config` TO maxscale_confsync@\'%\';
MaxScale must then be configured accordingly (on both MaxScale nodes) so that configuration synchronisation is activated. This configuration takes place in the global MaxScale section:
#
# /etc/maxscale.cnf
#
[maxscale]
config_sync_cluster = Replication-Monitor
config_sync_user = maxscale_confsync
config_sync_password = secret
The MaxScale nodes are then restarted:
shell > systemctl restart maxscale
MaxScale configuration synchronisation can also be activated and deactivated dynamically:
shell > maxctrl show maxscale | grep config_sync
│ │ \"config_sync_cluster\": null, │
│ │ \"config_sync_db\": \"mysql\", │
│ │ \"config_sync_interval\": \"5000ms\", │
│ │ \"config_sync_password\": null, │
│ │ \"config_sync_timeout\": \"10000ms\", │
│ │ \"config_sync_user\": null, │
Here it is important to keep to the correct order of the 3 commands, otherwise there will be an error:
shell > MAXCTRL_WARNINGS=0 maxctrl alter maxscale config_sync_user=\'maxscale_confsync\'
shell > MAXCTRL_WARNINGS=0 maxctrl alter maxscale config_sync_password=\'secret\'
shell > MAXCTRL_WARNINGS=0 maxctrl alter maxscale config_sync_cluster=\'Replication-Monitor\'
Change MaxScale parameters
As a first test, we have focussed on the MaxScale monitor variable monitor_interval, which in this case is even different on both MaxScale nodes:
shell > maxctrl show monitor Replication-Monitor | grep monitor_interval
│ │ \"monitor_interval\": \"750ms\",
shell > maxctrl show monitor Replication-Monitor | grep monitor_interval
│ │ \"monitor_interval\": \"1000ms\",
The variable can now be set on a MaxScale node with the alter monitor command:
shell > MAXCTRL_WARNINGS=0 maxctrl alter monitor Replication-Monitor monitor_interval=500ms
OK
which can be seen in the MaxScale error log:
2024-03-26 14:09:16 notice : (ConfigManager); Updating to configuration version 1
On the other hand, the value should be propagated to the second MaxScale node within 5 seconds (config_sync_interval), which can be checked with the above command.
Add new slave and make MaxScale known
A new slave (deb12-n3) is first created and added to the MariaDB replication cluster by hand. The slave is then made known to a MaxScale node:
shell > maxctrl create server deb12-n3 10.139.158.39
shell > MAXCTRL_WARNINGS=0 maxctrl link monitor Replication-Monitor deb12-n3
OK
shell > MAXCTRL_WARNINGS=0 maxctrl link service WriteService deb12-n3
OK
shell > maxctrl list servers
┌──────────┬────────────────┬──────┬─────────────┬─────────────────┬────────────┬─────────────────────┐
│ Server │ Address │ Port │ Connections │ State │ GTID │ Monitor │
├──────────┼────────────────┼──────┼─────────────┼─────────────────┼────────────┼─────────────────────┤
│ deb12-n1 │ 10.139.158.33 │ 3306 │ 3 │ Slave, Running │ 0-2-479618 │ Replication-Monitor │
├──────────┼────────────────┼──────┼─────────────┼─────────────────┼────────────┼─────────────────────┤
│ deb12-n2 │ 10.139.158.178 │ 3306 │ 3 │ Master, Running │ 0-2-479618 │ Replication-Monitor │
├──────────┼────────────────┼──────┼─────────────┼─────────────────┼────────────┼─────────────────────┤
│ deb12-n3 │ 10.139.158.39 │ 3306 │ 1 │ Slave, Running │ 0-2-479618 │ Replication-Monitor │
└──────────┴────────────────┴──────┴─────────────┴─────────────────┴────────────┴─────────────────────┘
Remove old slave and make MaxScale known
Before a slave can be deleted, it should be removed from the replication cluster for a MaxScale node:
shell > maxctrl destroy server deb12-n1 --force
OK
shell > maxctrl list servers
┌──────────┬────────────────┬──────┬─────────────┬─────────────────┬────────────┬─────────────────────┐
│ Server │ Address │ Port │ Connections │ State │ GTID │ Monitor │
├──────────┼────────────────┼──────┼─────────────┼─────────────────┼────────────┼─────────────────────┤
│ deb12-n2 │ 10.139.158.178 │ 3306 │ 3 │ Master, Running │ 0-2-493034 │ Replication-Monitor │
├──────────┼────────────────┼──────┼─────────────┼─────────────────┼────────────┼─────────────────────┤
│ deb12-n3 │ 10.139.158.39 │ 3306 │ 1 │ Slave, Running │ 0-2-493032 │ Replication-Monitor │
└──────────┴────────────────┴──────┴─────────────┴─────────────────┴────────────┴─────────────────────┘
The slave can then be removed.
How is the configuration synchronised?
The configuration of the two MaxScale nodes is synchronised via the database, which I personally consider to be an unfortunate design decision, as a configuration change could potentially cause chaos if the master breaks or network problems occur between the database nodes...
The configuration is stored in the table mysql.maxscale_config, which looks like this:
CREATE TABLE `maxscale_config` (
`cluster` varchar(256) NOT NULL,
`version` bigint(20) NOT NULL,
`config` longtext CHARACTER SET utf8mb4 COLLATE utf8mb4_bin NOT NULL CHECK (json_valid(`config`)),
`origin` varchar(254) NOT NULL,
`nodes` longtext CHARACTER SET utf8mb4 COLLATE utf8mb4_bin NOT NULL CHECK (json_valid(`nodes`)),
PRIMARY KEY (`cluster`)
) ENGINE=InnoDB DEFAULT CHARSET=utf8mb4 COLLATE=utf8mb4_general_ci
This table has approximately the following content:
SQL > SELECT cluster, version, CONCAT(SUBSTR(config, 1, 32), \' ... \', SUBSTR(config, -32)) AS config , origin, nodes FROM mysql.maxscale_config;
+---------------------+---------+-----------------------------------------------------------------------+------------+------------------------------------------+
| cluster | version | config | origin | nodes |
+---------------------+---------+-----------------------------------------------------------------------+------------+------------------------------------------+
| Replication-Monitor | 2 | {\"config\":[{\"id\":\"deb12-n1\",\"typ ... ter_name\":\"Replication-Monitor\"} | deb12-mxs1 | {\"deb12-mxs1\": \"OK\", \"deb12-mxs2\": \"OK\"} |
+---------------------+---------+-----------------------------------------------------------------------+------------+------------------------------------------+
A local copy is available on each node for security reasons:
shell > cut -b-32 /var/lib/maxscale/maxscale-config.json
{\"config\":[{\"id\":\"deb12-n2\",\"typ
What happens in the event of a conflict?
See also: Error Handling in Configuration Synchronization
If the configuration is changed simultaneously (within config_sync_interval?) on two different MaxScale nodes, we receive the following error message:
Error: Server at http://127.0.0.1:8989 responded with 400 Bad Request to `PATCH monitors/Replication-Monitor`
{
\"errors\": [
{
\"detail\": \"Cannot start configuration change: Configuration conflict detected: version stored in the cluster (3) is not the same as the local version (2), MaxScale is out of sync.\"
}
]
}
The following command may help to recognise the problem in the event of major faults:
shell > maxctrl show maxscale | grep -A9 \'Config Sync\'
│ Config Sync │ { │
│ │ \"checksum\": \"0052fe6f775168bf00778abbe37775f6f642adc7\", │
│ │ \"nodes\": { │
│ │ \"deb12-mxs1\": \"OK\", │
│ │ \"deb12-mxs2\": \"OK\" │
│ │ }, │
│ │ \"origin\": \"deb12-mxs2\", │
│ │ \"status\": \"OK\", │
│ │ \"version\": 3 │
│ │ } │
Tests
All tests were also carried out under load. The following tests ran in parallel:
insert_test.php
insert_test.sh
mixed_test.php
while [ true ] ; do mariadb -s --user=app --host=10.139.158.174 --port=3306 --password=secret --execute=\'SELECT @@hostname, COUNT(*) FROM test.test GROUP BY @@hostname\' ; sleep 0.5 ; done
while [ true ] ; do mariadb -s --user=app --host=10.139.158.174 --port=3306 --password=secret --execute=\'SELECT @@hostname, COUNT(*) FROM test.test GROUP BY @@hostname FOR UPDATE\' ; sleep 0.5 ; done
All tests have run flawlessly and without problems with all manipulations.
Deactivate MaxScale configuration synchronisation again
Execute the following command on both MaxScale nodes to end configuration synchronisation:
shell > MAXCTRL_WARNINGS=0 maxctrl alter maxscale config_sync_cluster=\'\'
Literature/sources
MaxScale globale Konfigurationsvariable: config_sync_cluster
MaxScale Configuration Synchronization
Pon Suresh Pandian, MariaDB, 24. August 2022: MariaDB MaxScale 6.0 Native Clustering
Where to get maxscale 6 mysql.maxscale_config table source sql
Setting up MariaDB MaxScale
Configuring the MariaDB Monitor
MariaDB MaxScale Load Balancer with Master/Master Replication
MariaDB Monitor - Configuration
Taxonomy upgrade extras: maxscaleconfigurationclusterload balancer
The post Shinguz: MaxScale configuration synchronisation appeared first on MariaDB.org.
]]>A feature that I recently discovered while browsing is the MaxScale configuration synchronisation functionality.
This is not primarily about a MariaDB replication cluster or a MariaDB Galera cluster, but about a cluster consisting of two or more MaxScale nodes. Or more precisely, the exchange of the configuration between these MaxScale nodes.
Pon Suresh Pandian has already written a blog article about this feature in 2022, which is even more detailed than this post here.
An LXD container environment was prepared, consisting of 3 database containers (deb12-n1 (10.139.158.33), deb12-n2 (10.139.158.178), deb12-n3 (10.139.158.39)) and 2 MaxScale containers (deb12-mxs1 (10.139.158.66), deb12-mxs2 (10.139.158.174)). The database version is a MariaDB 10.11.6 from the Debian repository and MaxScale was downloaded in version 22.08.5 from the MariaDB plc website.
The database configuration looks similar for all 3 nodes:
# # /etc/mysql/mariadb.conf.d/99-fromdual.cnf # [server] server_id = 1 log_bin = deb12-n1-binlog binlog_format = row bind_address = * proxy_protocol_networks = ::1, 10.139.158.0/24, localhost gtid_strict_mode = on log_slave_updates = on skip_name_resolve = on
The MaxScale nodes were built as described in the article Sharding with MariaDB MaxScale.
The maxscale_admin user has exactly the same rights as described there, the maxscale_monitor user has the following rights:
RELOAD, SUPER, REPLICATION SLAVE, READ_ONLY ADMIN
See also here: Required Grants.
The MaxScale start configuration looks like this:
# # /etc/maxscale.cnf # [maxscale] threads = auto admin_gui = false [deb12-n1] type = server address = 10.139.158.33 port = 3306 proxy_protocol = true [deb12-n2] type = server address = 10.139.158.178 port = 3306 proxy_protocol = true [Replication-Monitor] type = monitor module = mariadbmon servers = deb12-n1,deb12-n2 user = maxscale_monitor password = secret monitor_interval = 500ms auto_failover = true auto_rejoin = true enforce_read_only_slaves = true replication_user = replication replication_password = secret cooperative_monitoring_locks = majority_of_running [WriteListener] type = listener service = WriteService port = 3306 [WriteService] type = service router = readwritesplit servers = deb12-n1,deb12-n2 user = maxscale_admin password = secret transaction_replay = true transaction_replay_timeout = 30s
Important: The configuration should look the same on all MaxScale nodes!
And then a few more checks were done to be sure that everything is correct:
shell> maxctrl list listeners
┌───────────────┬──────┬──────┬─────────┬──────────────┐
│ Name          │ Port │ Host │ State   │ Service      │
├───────────────┼──────┼──────┼─────────┼──────────────┤
│ WriteListener │ 3306 │ ::   │ Running │ WriteService │
└───────────────┴──────┴──────┴─────────┴──────────────┘

shell> maxctrl list services
┌──────────────┬────────────────┬─────────────┬───────────────────┬────────────────────┐
│ Service      │ Router         │ Connections │ Total Connections │ Targets            │
├──────────────┼────────────────┼─────────────┼───────────────────┼────────────────────┤
│ WriteService │ readwritesplit │ 0           │ 0                 │ deb12-n1, deb12-n2 │
└──────────────┴────────────────┴─────────────┴───────────────────┴────────────────────┘

shell> maxctrl list servers
┌──────────┬────────────────┬──────┬─────────────┬─────────────────┬────────┬─────────────────────┐
│ Server   │ Address        │ Port │ Connections │ State           │ GTID   │ Monitor             │
├──────────┼────────────────┼──────┼─────────────┼─────────────────┼────────┼─────────────────────┤
│ deb12-n1 │ 10.139.158.33  │ 3306 │ 0           │ Master, Running │ 0-1-19 │ Replication-Monitor │
├──────────┼────────────────┼──────┼─────────────┼─────────────────┼────────┼─────────────────────┤
│ deb12-n2 │ 10.139.158.178 │ 3306 │ 0           │ Slave, Running  │ 0-1-19 │ Replication-Monitor │
└──────────┴────────────────┴──────┴─────────────┴─────────────────┴────────┴─────────────────────┘

SQL> SELECT @@hostname, test.* FROM test.test;
+------------+----+-----------+---------------------+
| @@hostname | id | data      | ts                  |
+------------+----+-----------+---------------------+
| deb12-n2   |  1 | Some data | 2024-03-26 09:40:21 |
+------------+----+-----------+---------------------+

SQL> SELECT @@hostname, test.* FROM test.test FOR UPDATE;
+------------+----+-----------+---------------------+
| @@hostname | id | data      | ts                  |
+------------+----+-----------+---------------------+
| deb12-n1   |  1 | Some data | 2024-03-26 09:40:21 |
+------------+----+-----------+---------------------+
And another test whether MaxScale really executes the failover correctly:
shell> systemctl stop mariadb
2024-03-26 16:27:05   error  : Monitor was unable to connect to server deb12-n2[10.139.158.178:3306] : 'Can't connect to server on '10.139.158.178' (115)'
2024-03-26 16:27:05   notice : Server changed state: deb12-n2[10.139.158.178:3306]: master_down. [Master, Running] -> [Down]
2024-03-26 16:27:05   warning: [mariadbmon] Primary has failed. If primary does not return in 4 monitor tick(s), failover begins.
2024-03-26 16:27:07   notice : [mariadbmon] Selecting a server to promote and replace 'deb12-n2'. Candidates are: 'deb12-n1'.
2024-03-26 16:27:07   notice : [mariadbmon] Selected 'deb12-n1'.
2024-03-26 16:27:07   notice : [mariadbmon] Performing automatic failover to replace failed primary 'deb12-n2'.
2024-03-26 16:27:07   notice : [mariadbmon] Failover 'deb12-n2' -> 'deb12-n1' performed.
2024-03-26 16:27:07   notice : Server changed state: deb12-n1[10.139.158.33:3306]: new_master. [Slave, Running] -> [Master, Running]

shell> systemctl start mariadb
2024-03-26 16:28:03   notice : Server changed state: deb12-n2[10.139.158.178:3306]: server_up. [Down] -> [Running]
2024-03-26 16:28:03   notice : [mariadbmon] Directing standalone server 'deb12-n2' to replicate from 'deb12-n1'.
2024-03-26 16:28:03   notice : [mariadbmon] Replica connection from deb12-n2 to [10.139.158.33]:3306 created and started.
2024-03-26 16:28:03   notice : [mariadbmon] 1 server(s) redirected or rejoined the cluster.
2024-03-26 16:28:03   notice : Server changed state: deb12-n2[10.139.158.178:3306]: new_slave. [Running] -> [Slave, Running]
Which MaxScale node is currently responsible for monitoring and failover (cooperatve_monitoring) can be determined as follows:
shell> maxctrl show monitor Replication-Monitor | grep -e 'Diagnostics' -e '"primary"' -e 'lock_held' | uniq
│ Monitor Diagnostics │ {                                                                                                                                                                                                                      │
│                     │     "primary": true,                                                                                                                                                                                                   │
│                     │             "lock_held": true,                                                                                                                                                                                         │
It should be ensured that everything works properly up to this point. Otherwise there is no real point in the next steps.
A separate database user with the following rights is required for configuration synchronisation:
SQL> CREATE USER 'maxscale_confsync'@'%' IDENTIFIED BY 'secret';
SQL> GRANT SELECT, INSERT, UPDATE, CREATE ON `mysql`.`maxscale_config` TO maxscale_confsync@'%';
MaxScale must then be configured accordingly (on both MaxScale nodes) so that configuration synchronisation is activated. This configuration takes place in the global MaxScale section:
#
# /etc/maxscale.cnf
#

[maxscale]
config_sync_cluster  = Replication-Monitor
config_sync_user     = maxscale_confsync
config_sync_password = secret
The MaxScale nodes are then restarted:
shell> systemctl restart maxscale
MaxScale configuration synchronisation can also be activated and deactivated dynamically:
shell> maxctrl show maxscale | grep config_sync
│              │     "config_sync_cluster": null,                                        │
│              │     "config_sync_db": "mysql",                                          │
│              │     "config_sync_interval": "5000ms",                                   │
│              │     "config_sync_password": null,                                       │
│              │     "config_sync_timeout": "10000ms",                                   │
│              │     "config_sync_user": null,                                           │
Here it is important to keep to the correct order of the 3 commands, otherwise there will be an error:
shell> MAXCTRL_WARNINGS=0 maxctrl alter maxscale config_sync_user='maxscale_confsync'
shell> MAXCTRL_WARNINGS=0 maxctrl alter maxscale config_sync_password='secret'
shell> MAXCTRL_WARNINGS=0 maxctrl alter maxscale config_sync_cluster='Replication-Monitor'
As a first test, we have focussed on the MaxScale monitor variable monitor_interval, which in this case is even different on both MaxScale nodes:
shell>  maxctrl show monitor Replication-Monitor | grep monitor_interval
│                     │     "monitor_interval": "750ms",

shell> maxctrl show monitor Replication-Monitor | grep monitor_interval
│                     │     "monitor_interval": "1000ms",
The variable can now be set on a MaxScale node with the alter monitor command:
shell> MAXCTRL_WARNINGS=0 maxctrl alter monitor Replication-Monitor monitor_interval=500ms
OK
which can be seen in the MaxScale error log:
2024-03-26 14:09:16 notice : (ConfigManager); Updating to configuration version 1
On the other hand, the value should be propagated to the second MaxScale node within 5 seconds (config_sync_interval), which can be checked with the above command.
A new slave (deb12-n3) is first created and added to the MariaDB replication cluster by hand. The slave is then made known to a MaxScale node:
shell> maxctrl create server deb12-n3 10.139.158.39

shell> MAXCTRL_WARNINGS=0 maxctrl link monitor Replication-Monitor deb12-n3
OK

shell> MAXCTRL_WARNINGS=0 maxctrl link service WriteService deb12-n3
OK

shell> maxctrl list servers
┌──────────┬────────────────┬──────┬─────────────┬─────────────────┬────────────┬─────────────────────┐
│ Server   │ Address        │ Port │ Connections │ State           │ GTID       │ Monitor             │
├──────────┼────────────────┼──────┼─────────────┼─────────────────┼────────────┼─────────────────────┤
│ deb12-n1 │ 10.139.158.33  │ 3306 │ 3           │ Slave, Running  │ 0-2-479618 │ Replication-Monitor │
├──────────┼────────────────┼──────┼─────────────┼─────────────────┼────────────┼─────────────────────┤
│ deb12-n2 │ 10.139.158.178 │ 3306 │ 3           │ Master, Running │ 0-2-479618 │ Replication-Monitor │
├──────────┼────────────────┼──────┼─────────────┼─────────────────┼────────────┼─────────────────────┤
│ deb12-n3 │ 10.139.158.39  │ 3306 │ 1           │ Slave, Running  │ 0-2-479618 │ Replication-Monitor │
└──────────┴────────────────┴──────┴─────────────┴─────────────────┴────────────┴─────────────────────┘
Before a slave can be deleted, it should be removed from the replication cluster for a MaxScale node:
shell> maxctrl destroy server deb12-n1 --force
OK

shell> maxctrl list servers
┌──────────┬────────────────┬──────┬─────────────┬─────────────────┬────────────┬─────────────────────┐
│ Server   │ Address        │ Port │ Connections │ State           │ GTID       │ Monitor             │
├──────────┼────────────────┼──────┼─────────────┼─────────────────┼────────────┼─────────────────────┤
│ deb12-n2 │ 10.139.158.178 │ 3306 │ 3           │ Master, Running │ 0-2-493034 │ Replication-Monitor │
├──────────┼────────────────┼──────┼─────────────┼─────────────────┼────────────┼─────────────────────┤
│ deb12-n3 │ 10.139.158.39  │ 3306 │ 1           │ Slave, Running  │ 0-2-493032 │ Replication-Monitor │
└──────────┴────────────────┴──────┴─────────────┴─────────────────┴────────────┴─────────────────────┘
The slave can then be removed.
The configuration of the two MaxScale nodes is synchronised via the database, which I personally consider to be an unfortunate design decision, as a configuration change could potentially cause chaos if the master breaks or network problems occur between the database nodes…
The configuration is stored in the table mysql.maxscale_config, which looks like this:
CREATE TABLE `maxscale_config` (
  `cluster` varchar(256) NOT NULL,
  `version` bigint(20) NOT NULL,
  `config` longtext CHARACTER SET utf8mb4 COLLATE utf8mb4_bin NOT NULL CHECK (json_valid(`config`)),
  `origin` varchar(254) NOT NULL,
  `nodes` longtext CHARACTER SET utf8mb4 COLLATE utf8mb4_bin NOT NULL CHECK (json_valid(`nodes`)),
  PRIMARY KEY (`cluster`)
) ENGINE=InnoDB DEFAULT CHARSET=utf8mb4 COLLATE=utf8mb4_general_ci
This table has approximately the following content:
SQL> SELECT cluster, version, CONCAT(SUBSTR(config, 1, 32), ' ... ', SUBSTR(config, -32)) AS config , origin, nodes FROM mysql.maxscale_config;
+---------------------+---------+-----------------------------------------------------------------------+------------+------------------------------------------+
| cluster             | version | config                                                                | origin     | nodes                                    |
+---------------------+---------+-----------------------------------------------------------------------+------------+------------------------------------------+
| Replication-Monitor |       2 | {"config":[{"id":"deb12-n1","typ ... ter_name":"Replication-Monitor"} | deb12-mxs1 | {"deb12-mxs1": "OK", "deb12-mxs2": "OK"} |
+---------------------+---------+-----------------------------------------------------------------------+------------+------------------------------------------+
A local copy is available on each node for security reasons:
shell> cut -b-32 /var/lib/maxscale/maxscale-config.json
{"config":[{"id":"deb12-n2","typ
See also: Error Handling in Configuration Synchronization
If the configuration is changed simultaneously (within config_sync_interval?) on two different MaxScale nodes, we receive the following error message:
Error: Server at http://127.0.0.1:8989 responded with 400 Bad Request to `PATCH monitors/Replication-Monitor`
{
    "errors": [
        {
            "detail": "Cannot start configuration change: Configuration conflict detected: version stored in the cluster (3) is not the same as the local version (2), MaxScale is out of sync."
        }
    ]
}
The following command may help to recognise the problem in the event of major faults:
shell> maxctrl show maxscale | grep -A9 'Config Sync'
│ Config Sync  │ {                                                                       │
│              │     "checksum": "0052fe6f775168bf00778abbe37775f6f642adc7",             │
│              │     "nodes": {                                                          │
│              │         "deb12-mxs1": "OK",                                             │
│              │         "deb12-mxs2": "OK"                                              │
│              │     },                                                                  │
│              │     "origin": "deb12-mxs2",                                             │
│              │     "status": "OK",                                                     │
│              │     "version": 3                                                        │
│              │ }                                                                       │
All tests were also carried out under load. The following tests ran in parallel:
insert_test.phpinsert_test.shmixed_test.phpwhile [ true ] ; do mariadb -s --user=app --host=10.139.158.174 --port=3306 --password=secret --execute='SELECT @@hostname, COUNT(*) FROM test.test GROUP BY @@hostname' ; sleep 0.5 ; donewhile [ true ] ; do mariadb -s --user=app --host=10.139.158.174 --port=3306 --password=secret --execute='SELECT @@hostname, COUNT(*) FROM test.test GROUP BY @@hostname FOR UPDATE' ; sleep 0.5 ; doneAll tests have run flawlessly and without problems with all manipulations.
Execute the following command on both MaxScale nodes to end configuration synchronisation:
shell> MAXCTRL_WARNINGS=0 maxctrl alter maxscale config_sync_cluster=''
The post Shinguz: MaxScale configuration synchronisation appeared first on MariaDB.org.
]]>Behavior Changes
In this version, we have made some changes that might affect existing scripts and integration tools. It\'s essential to review and update any scripts or environments that rely on Tungsten Cluster with these modifications.
Installation and Deployment
The systemd startup scripts now depend on the time-sync service (if available) being started before tungsten components.
Improvements, New Features, and Functionality: Elevate Your Database Management
We\'re constantly striving to improve user experience and functionality. In this release, we have introduced several enhancements and new features.
INI Option Addition
A new INI option, rest-api-admin-password, has been added as an alias for the existing rest-api-admin-pass option, providing more flexibility in configuration.
New Command-line Tool
We\'ve introduced a new command-line tool called tungsten_mysql_ssl_setup. This tool creates all necessary security files for the MySQL database server, serving as a replacement for mysql_ssl_rsa_setup, which is not included with Percona Server or MariaDB. Additionally, tungsten_mysql_ssl_setup will now be invoked by tpm cert gen mysqlcerts instead of mysql_ssl_rsa_setup.
tpm diag Command Updates
The tpm diag command was updated and now includes the results of the sestatus and getenforce commands.
Bug Fixes
In addition to these enhancements, we\'ve addressed a multitude of bug fixes across various aspects of Tungsten Clustering & Tungsten Replicator, ensuring a smoother and more reliable experience.
Release Notes
You can review the full release notes here:
Tungsten Clustering
Tungsten Replicator
Upgrade Today for a More Powerful Database Management Experience
We encourage all users to upgrade to Tungsten Cluster and Tungsten Replicator v7.1.2 to take advantage of these improvements and bug fixes. For detailed instructions on upgrading and installation, please refer to the documentation.
Thank you for your continued support and feedback. We\'re committed to delivering high-quality solutions that meet your evolving needs.
Tags: tungsten clusteringtungsten replicatorMySQLMariaDBreleasesSeries: Continuent NewsIcon ID: download2
The post Introducing Tungsten Cluster & Tungsten Replicator v7.1.2 appeared first on MariaDB.org.
]]>We are excited to announce the release of Tungsten Cluster and Tungsten Replicator version 7.1.2, packed with enhancements, new features, and important bug fixes. This release focuses on improving installation and deployment processes, enhancing command-line tools, and addressing critical issues to ensure a seamless experience for our users.
In this version, we have made some changes that might affect existing scripts and integration tools. It’s essential to review and update any scripts or environments that rely on Tungsten Cluster with these modifications.
The systemd startup scripts now depend on the time-sync service (if available) being started before tungsten components.
We’re constantly striving to improve user experience and functionality. In this release, we have introduced several enhancements and new features.
A new INI option, rest-api-admin-password, has been added as an alias for the existing rest-api-admin-pass option, providing more flexibility in configuration.
We’ve introduced a new command-line tool called tungsten_mysql_ssl_setup. This tool creates all necessary security files for the MySQL database server, serving as a replacement for mysql_ssl_rsa_setup, which is not included with Percona Server or MariaDB. Additionally, tungsten_mysql_ssl_setup will now be invoked by tpm cert gen mysqlcerts instead of mysql_ssl_rsa_setup.
tpm diag Command Updates
The tpm diag command was updated and now includes the results of the sestatus and getenforce commands.
In addition to these enhancements, we’ve addressed a multitude of bug fixes across various aspects of Tungsten Clustering & Tungsten Replicator, ensuring a smoother and more reliable experience.
You can review the full release notes here:
We encourage all users to upgrade to Tungsten Cluster and Tungsten Replicator v7.1.2 to take advantage of these improvements and bug fixes. For detailed instructions on upgrading and installation, please refer to the documentation.
Thank you for your continued support and feedback. We’re committed to delivering high-quality solutions that meet your evolving needs.
The post Introducing Tungsten Cluster & Tungsten Replicator v7.1.2 appeared first on MariaDB.org.
]]>The post MySQL 101: How to Find and Tune a Slow MySQL Query appeared first on MariaDB.org.
]]> This blog was originally published in June 2020 and was updated in April 2024.One of the most common support tickets we get at Percona is the infamous “database is running slower” ticket. While this can be caused by a multitude of factors, it is more often than not caused by a bad or slow MySQL […]
The post MySQL 101: How to Find and Tune a Slow MySQL Query appeared first on MariaDB.org.
]]>The post PostgreSQL for MySQL DBAs Second Edition Is Now Available appeared first on MariaDB.org.
]]> Many years ago, when I was the Certification Manager for MySQL AB, I would be in contact with hiring managers looking for talent. One frustrated individual informed me that while it was hard to find a qualified MySQL DBA, it was impossible to find a qualified PostgreSQL DBA. Years later, that same sentiment is still […]
The post PostgreSQL for MySQL DBAs Second Edition Is Now Available appeared first on MariaDB.org.
]]>The post How to Find Duplicate, Unused, and Invisible Indexes in MySQL appeared first on MariaDB.org.
]]> This blog was originally published in January 2023 and was updated in April 2024.MySQL index is a data structure used to optimize the performance of database queries at the expense of additional writes and storage space to keep the index data structure up to date. It is used to quickly locate data without having to […]
The post How to Find Duplicate, Unused, and Invisible Indexes in MySQL appeared first on MariaDB.org.
]]>The post MariaDB Community Server 11.4 LTS: What This Means For Customers appeared first on MariaDB.org.
]]>The post MariaDB Community Server 11.4 LTS: What This Means For Customers appeared first on MariaDB.org.
]]>The post MariaDB Server 11.4 will be LTS appeared first on MariaDB.org.
]]>Continue reading “MariaDB Server 11.4 will be LTS”
The post MariaDB Server 11.4 will be LTS appeared first on MariaDB.org.
The post MariaDB Server 11.4 will be LTS appeared first on MariaDB.org.
]]>The post Release Roundup April 2, 2024 appeared first on MariaDB.org.
]]>The post Release Roundup April 2, 2024 appeared first on MariaDB.org.
]]>The post caching_sha2_password Support for ProxySQL Is Finally Available! appeared first on MariaDB.org.
]]> ProxySQL recently released version 2.6.0, and going through the release notes, I focused on the following:Added support for caching_sha2_password!This is great news for the community! The caching_sha2_password authentication method for frontend connections is now available. This has been a long-awaited feature …Why?Because in MySQL 8, caching_sha2_password has been the default authentication method. Starting from MySQL […]
The post caching_sha2_password Support for ProxySQL Is Finally Available! appeared first on MariaDB.org.
]]>The post A MyLoader Error You Might Face When Restoring Databases appeared first on MariaDB.org.
]]> At Percona Managed Services, we manage Percona for MySQL, MySQL Community, MariaDB, and other software. Sometimes we might need to use mydumper/myloader to restore one or more databases from the production environment to the lower environment for testing. The automated restore process ran well until one day, we got the error below.0. The error we face […]
The post A MyLoader Error You Might Face When Restoring Databases appeared first on MariaDB.org.
]]>The post How Missing Primary Keys Break Your Galera Cluster appeared first on MariaDB.org.
]]> Any Galera documentation about limitations will state that tables must have primary keys. They state that DELETEs are unsupported and other DMLs could have unwanted side-effects such as inconsistent ordering: rows can appear in different order on different nodes in your cluster.If you are not actively relying on row orders, this could seem acceptable. Deletes […]
The post How Missing Primary Keys Break Your Galera Cluster appeared first on MariaDB.org.
]]>The post Galera Manager March 2024 Release now includes UI improvements and a SSH console tab appeared first on MariaDB.org.
]]>The biggest facing user items in this release include a “jobs” tracker. It can be a flat list or a hierarchical view, and you will notice that this is not just for a cluster wide view, but also for individual nodes. Naturally on the left hand menu, you will also see Jobs listed there; this is to show jobs that do not belong to any cluster.
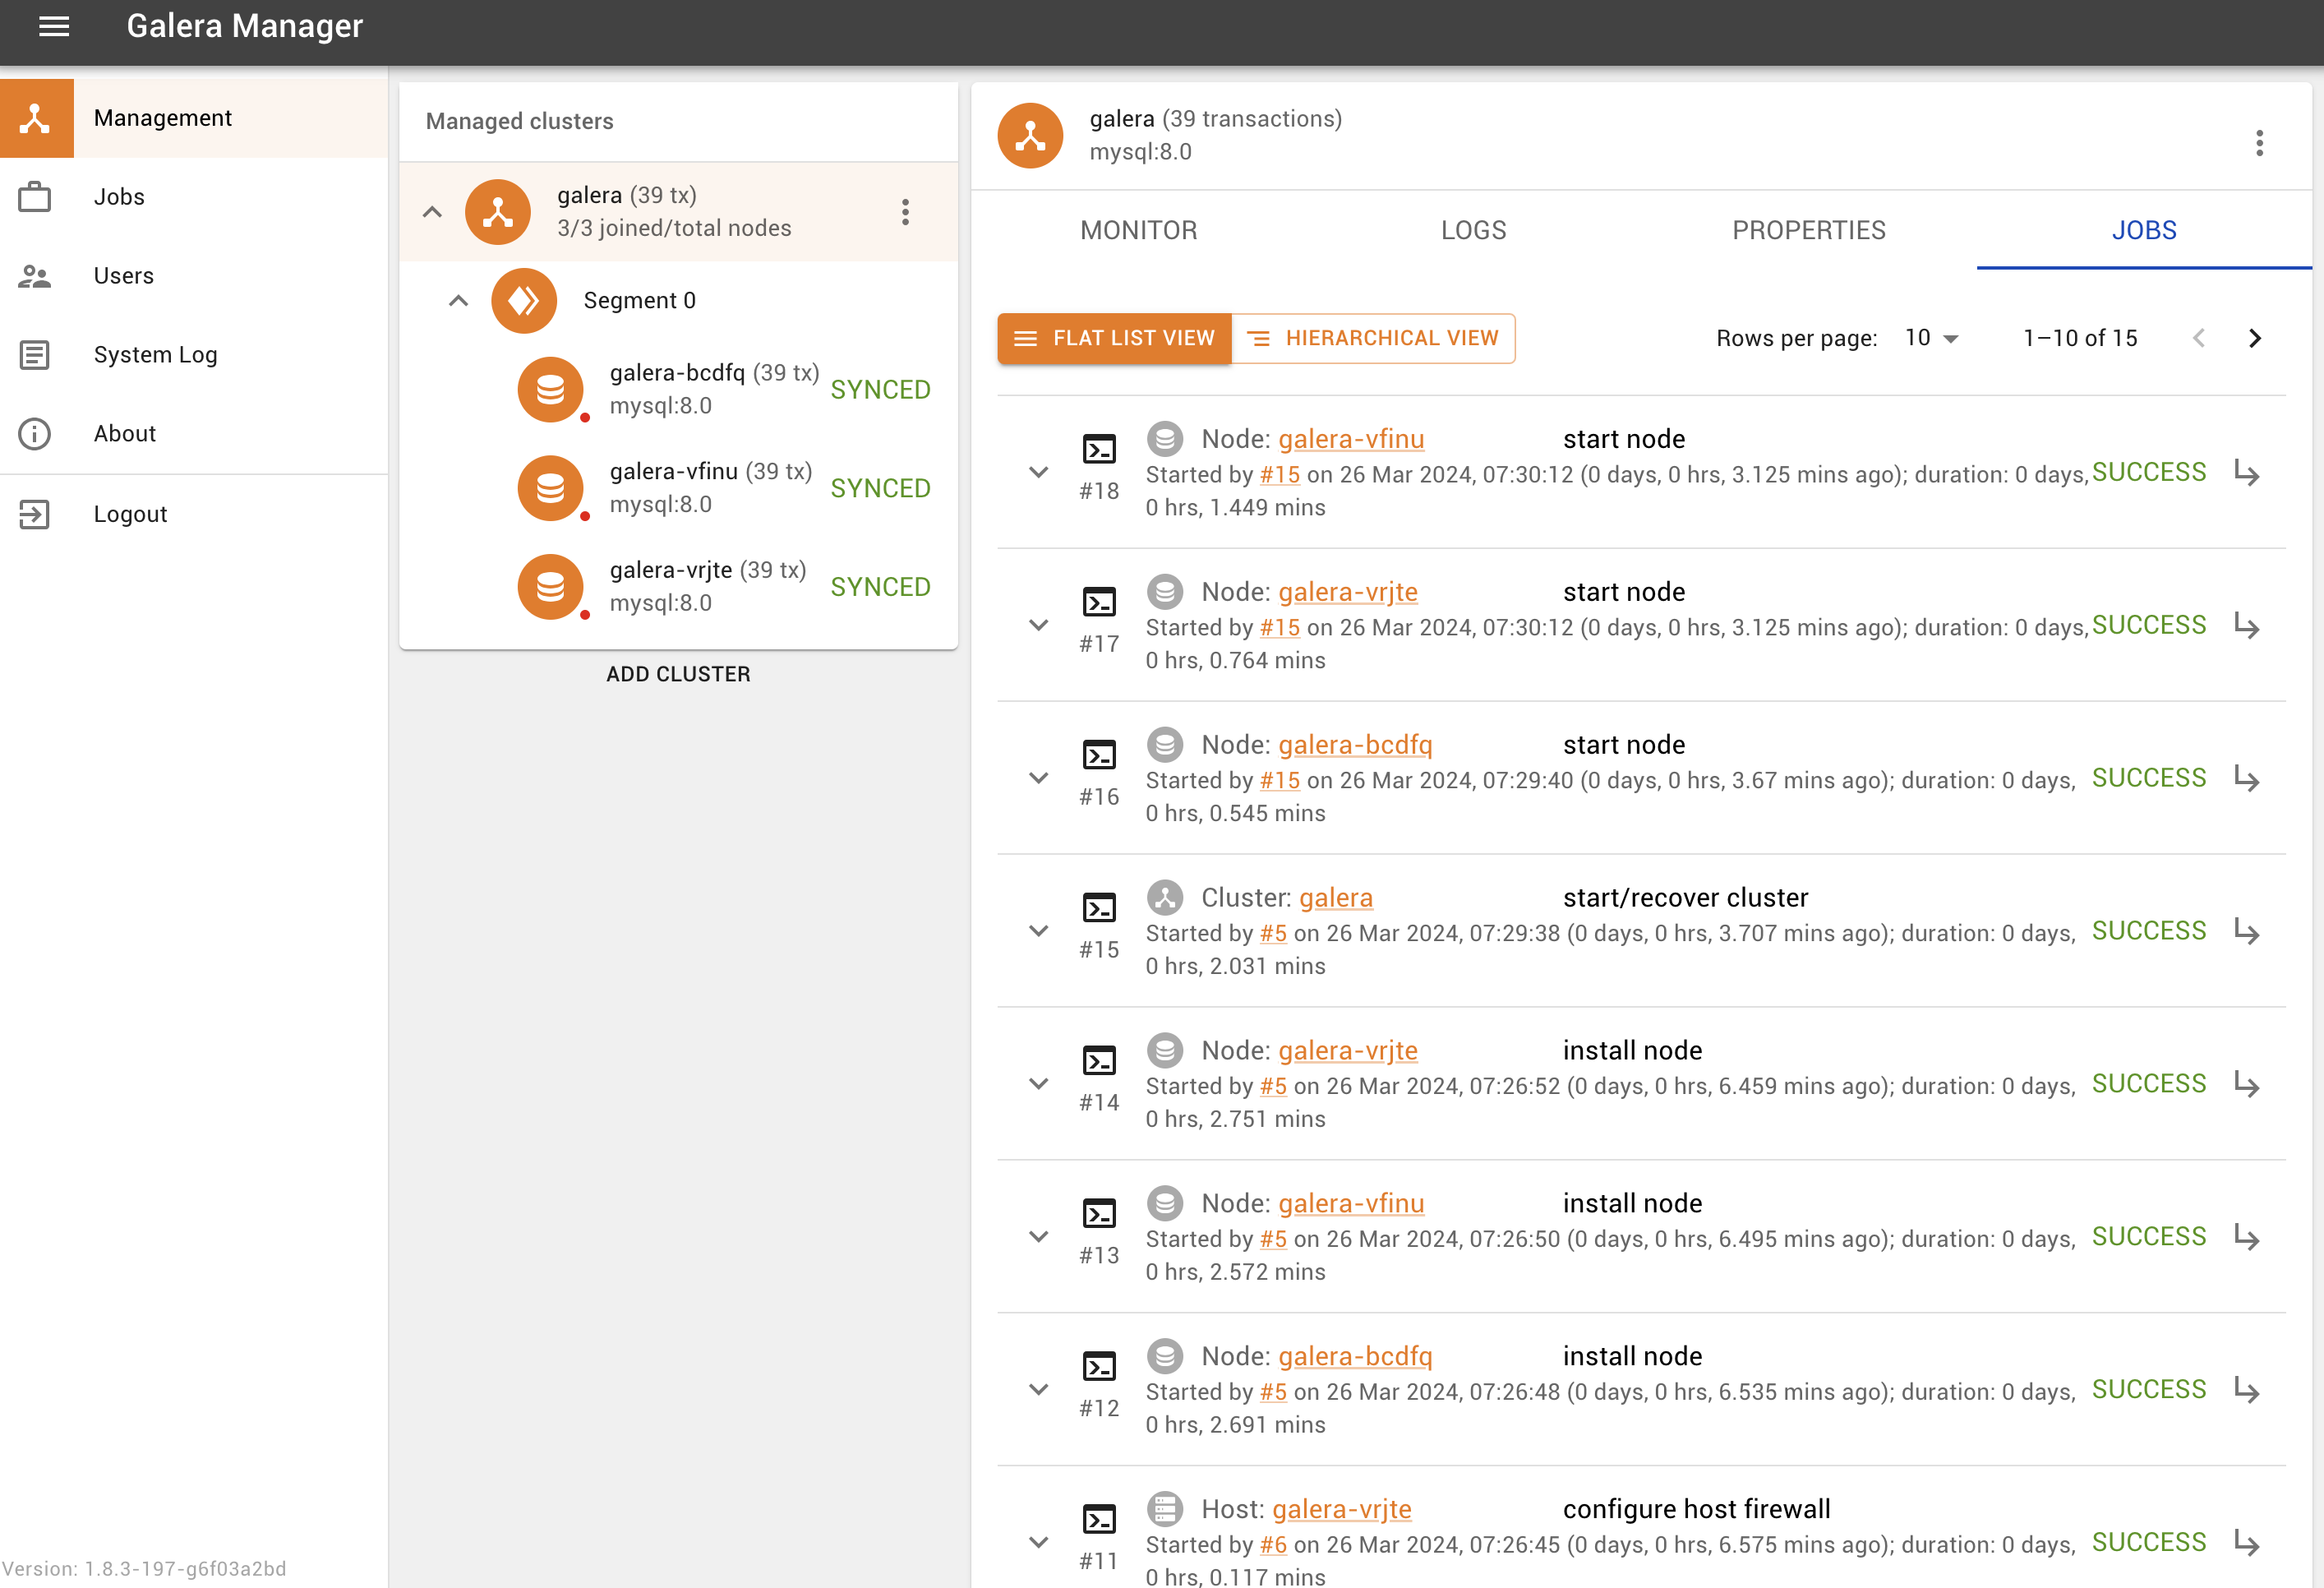
Another user feature that one would notice is that the SSH console is now a tab that is in the menu right after jobs. You can still pop it out, but it is a little more integrated within the UI.
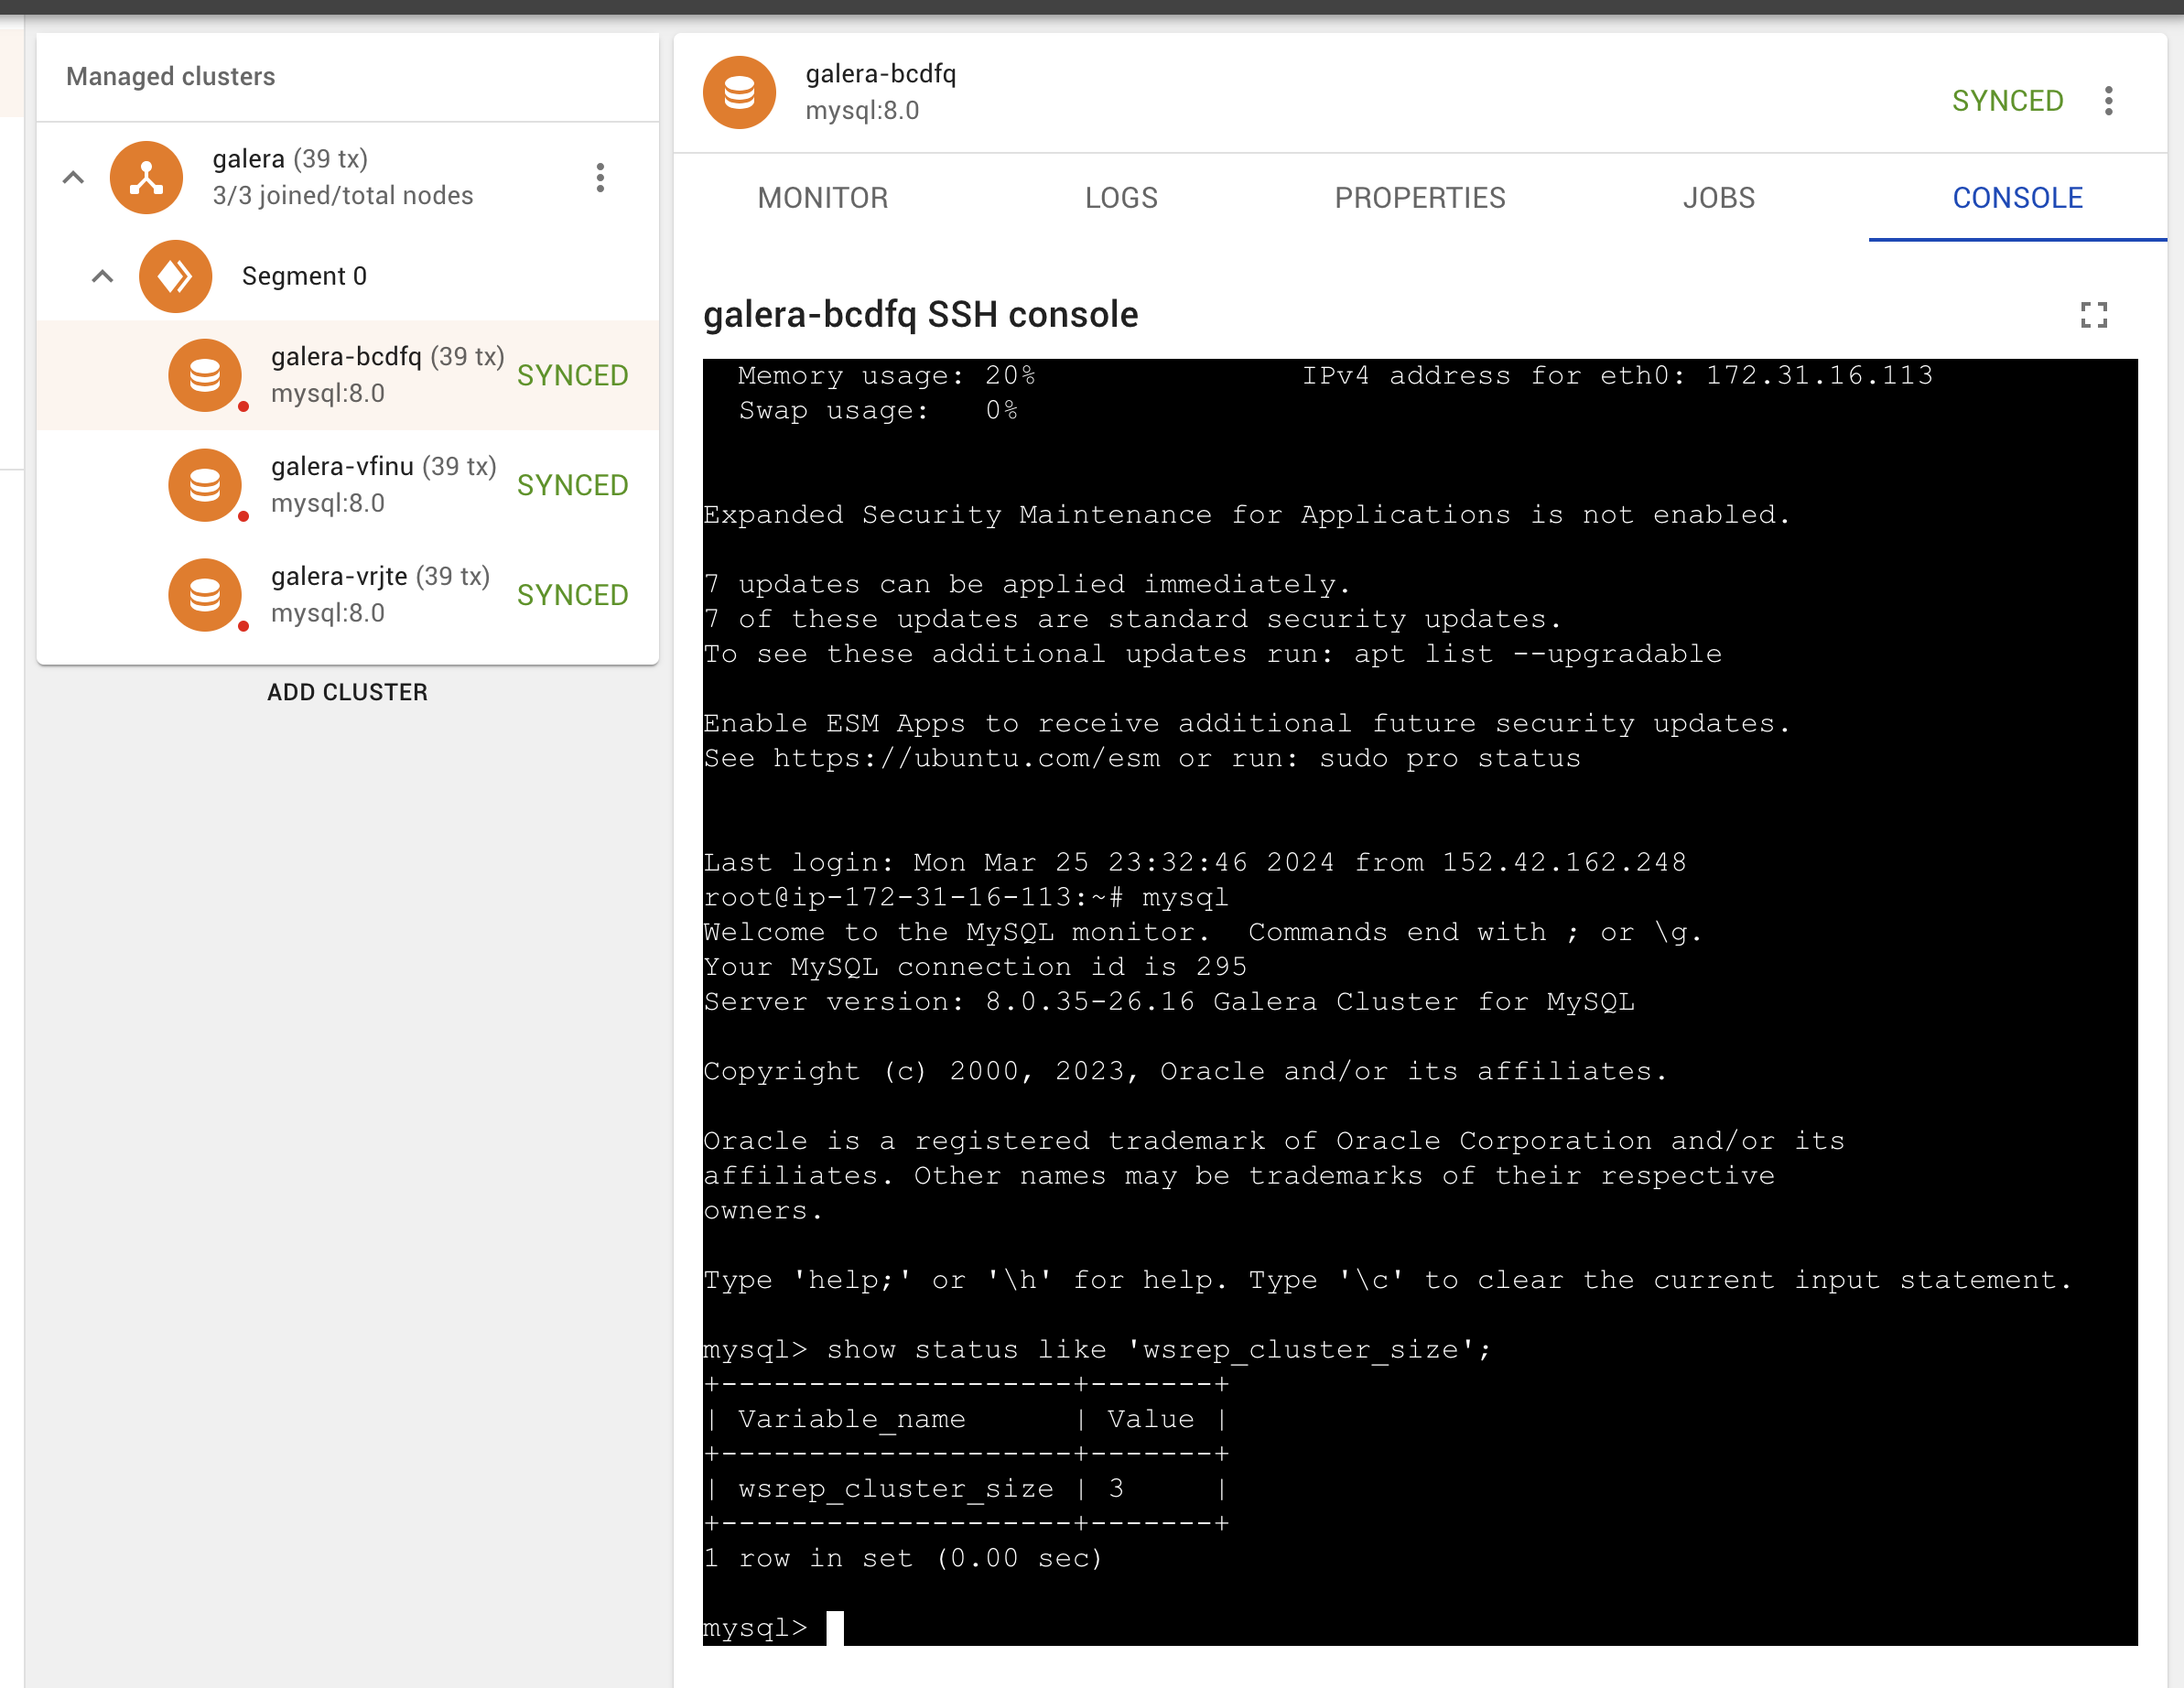
In addition to that, unsupported Ubuntu 18.04 has been removed, and there is full support for Debian 12.
A few notes from the internal changelog that is published in the application (and also on the Galera Manager Changelog):
Please download Galera Manager and we look forward to your feedback. Note that we also plan to have a webinar on the latest release of Galera Manager, so keep your eyes peeled on the blog, and on our mailing list!
The post Galera Manager March 2024 Release now includes UI improvements and a SSH console tab appeared first on MariaDB.org.
]]>The post MariaDB Wins at the CloudFest Hackathon appeared first on MariaDB.org.
]]>Continue reading “MariaDB Wins at the CloudFest Hackathon”
The post MariaDB Wins at the CloudFest Hackathon appeared first on MariaDB.org.
The post MariaDB Wins at the CloudFest Hackathon appeared first on MariaDB.org.
]]>The post What’s new in PG15 appeared first on MariaDB.org.
]]>Of course, there are some drawbacks to releasing major versions so often. One is that it can be difficult for users to keep up with the latest changes. Another is that it can be more challenging to upgrade to a new major version, as the internal data storage format may change. However, the benefits of releasing major versions often outweigh the drawbacks.
By releasing new features and improvements on a regular basis, the PGDG is able to keep PostgreSQL at the forefront of database technology. This makes PostgreSQL a good choice for organizations that need a powerful and reliable database.
The current stable version of PostgreSQL is 15.3. In this blog, we will review features, improvements, and major updates in PostgreSQL 15.
The SQL MERGE statement is a powerful tool for data manipulation that allows you to conditionally insert, update, or delete data. It was officially introduced in the SQL ANSI 2003 standard, and expanded in the SQL ANSI 2008 standard.
The SQL MERGE statement works by merging data from two tables into a single table. The two tables are called the target table and the source table. The merge condition is a Boolean expression that determines which rows in the target table should be updated, inserted, or deleted.
The MERGE statement has three clauses:
The search_condition is an optional expression that can be used to further refine the rows that are updated, inserted, or deleted.
PostgreSQL added the SQL MERGE feature in this release which will add value for the organization who uses it for processing the data.
PostgreSQL 15 introduced Zstandard and LZ4 as an option for compression method, so we have more options instead of pglz for WAL compression. Some benefits of the new options include:
We can also use the compression method for the backup on the server side to compress the backup size; thus, it will reduce the size significantly resulting in less data transfer over the network.
PostgreSQL 15 includes a new feature that enables you to convert your database logs into JSON format, ensuring compatibility with the preferred data structure among tech professionals. This “structured log” can also be utilized by various tools for storage and examination purposes.
Several enhancements have been made in PostgreSQL 15, such as:
Additionally, two new server variables have been introduced:
ClusterControl supports PostgreSQL version 15 as the latest version, so you can deploy PostgreSQL database both standalone and clusters database using streaming replication through the ClusterControl UI easily.
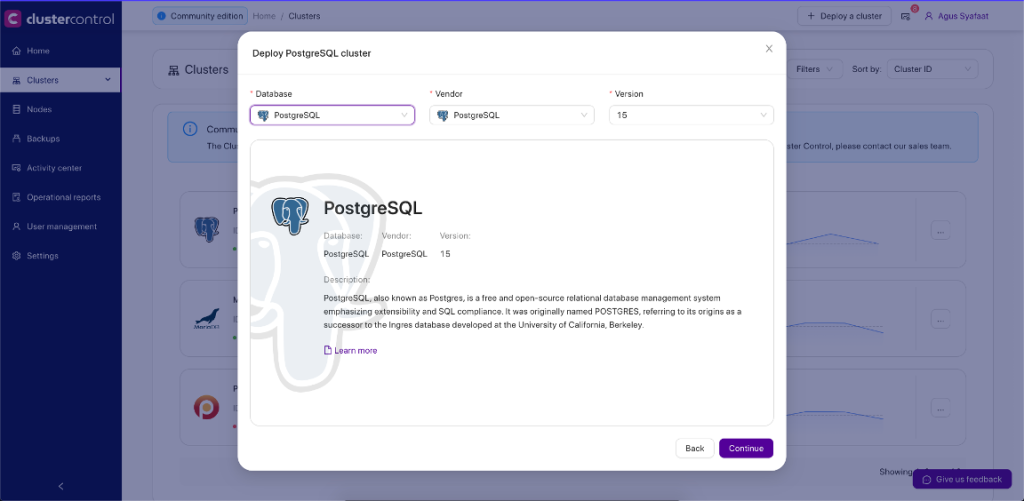
You can utilize the new feature after the PostgreSQL is deployed using ClusterControl.
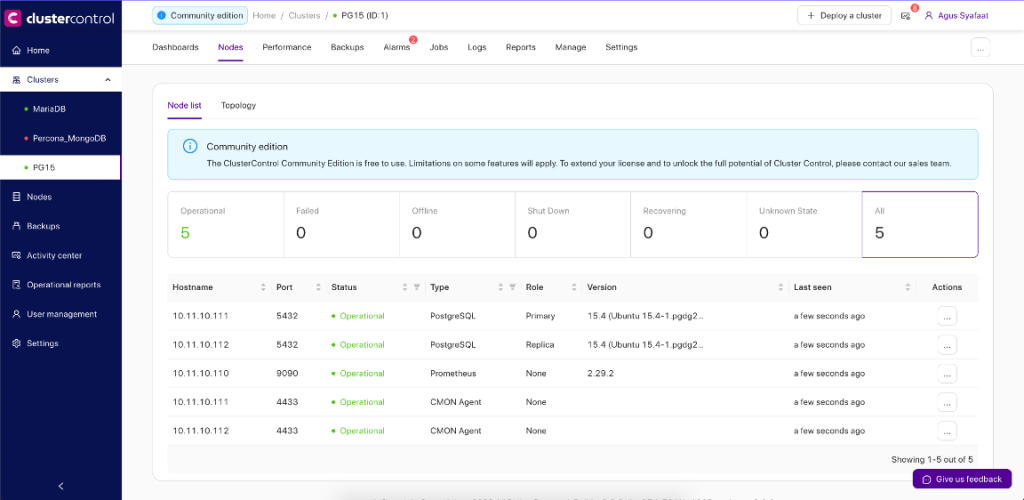
As of ClusterControl 1.9.8, PostgreSQL users can now perform major in-place version upgrades in ClusterControl. Currently, you can only upgrade one step ahead, for example from version 13 to 14 or from version 14 to 15. If your current version is further than one step away from your destination version, PG 13 to PG 15 for example, you can still upgrade to your destination by repeating the process until you get there.
Thankfully, performing major version upgrades is very easy — I’ll show you how by upgrading from PostgreSQL version 14 to 15:
1.Go to the PostgreSQL cluster in ClusterControl, choose the Cluster Menu -> Upgrades. You will see the following dialogue:
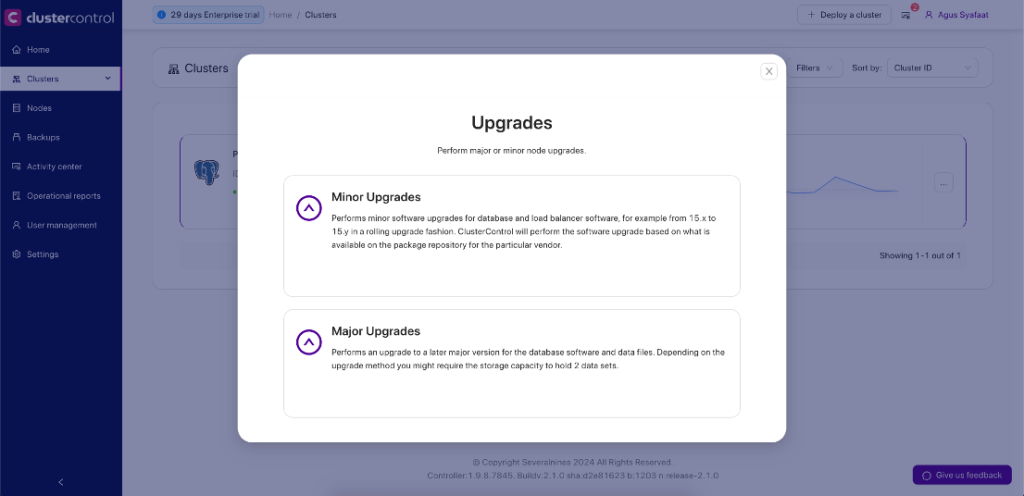
2.Choose the Major Upgrades. You will see the following page to choose the upgrade method:
N.B. If PostgreSQL is running the latest version, the Major Upgrade button will be grayed out.
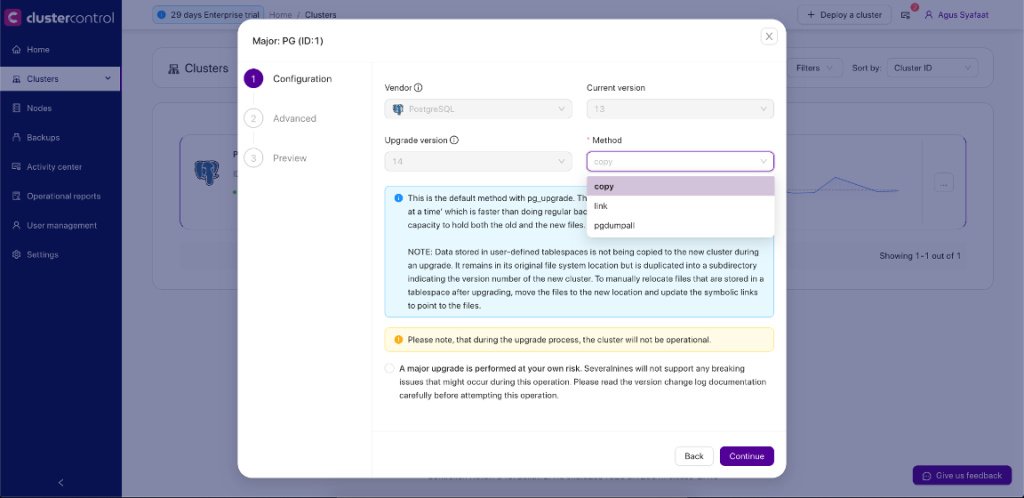
ClusterControl currently provides 3 methods for the upgrades, copy, link, and pgdumpall.
3.The next step is to configure the temporary ports for the new cluster.
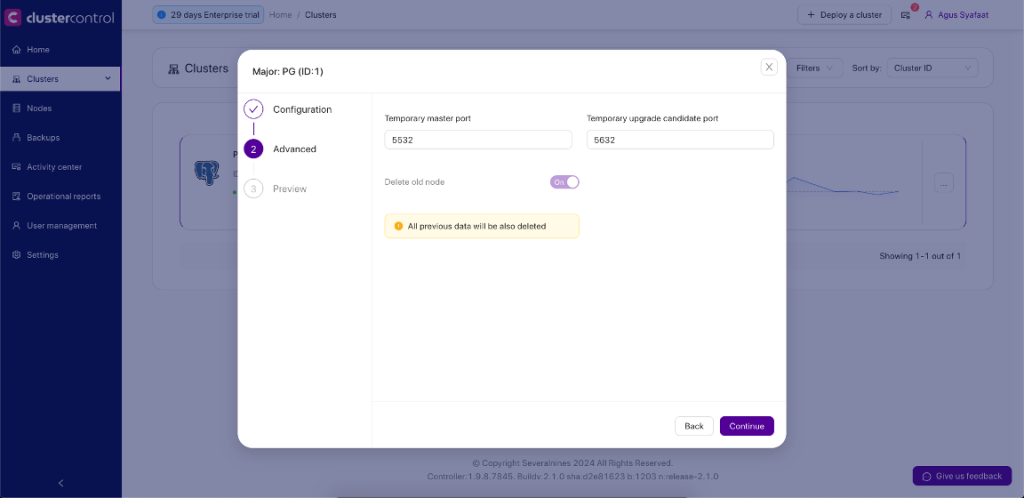
4.You will preview the parameters of your major upgrade before you submit the job.
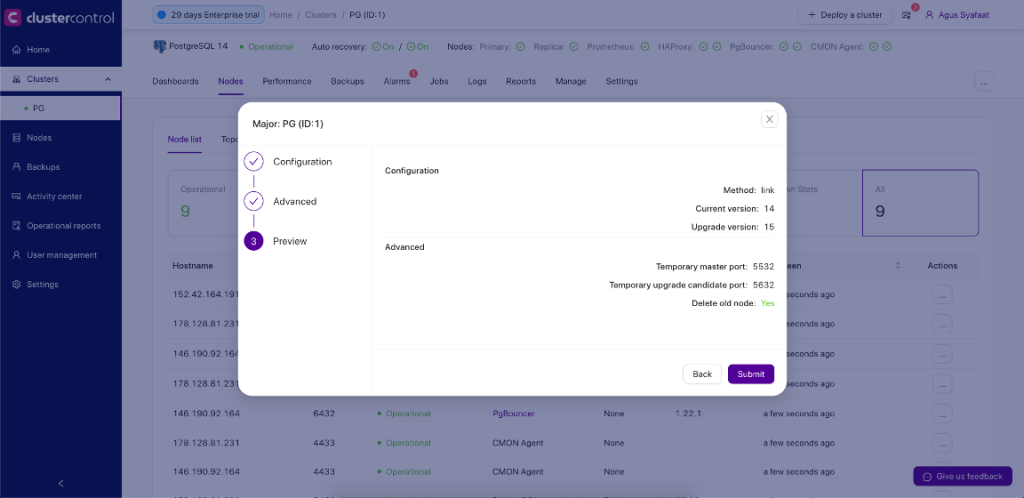
5.Later you can see the Job Activity log about the Major Upgrade to version 15 as below:
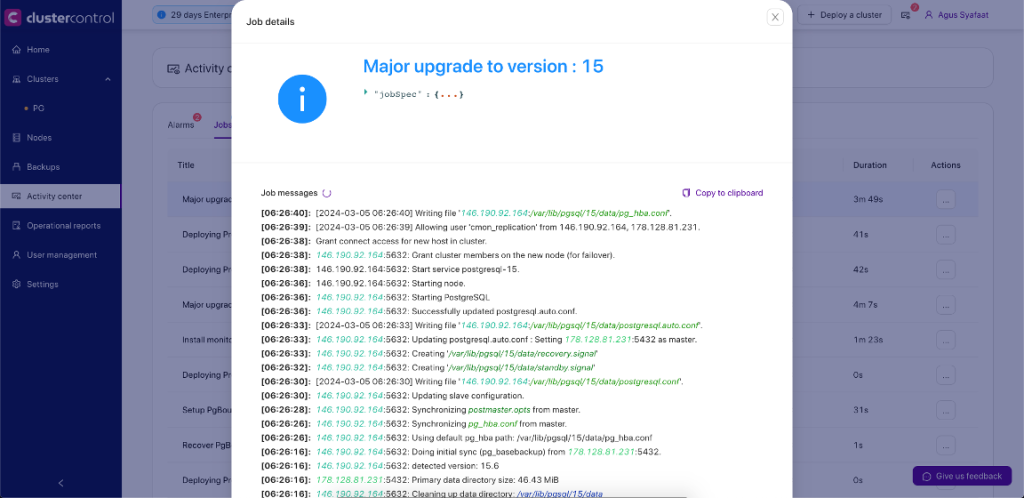
PostgreSQL continually makes significant advancements in enhancing its performance and introducing fresh capabilities with each new release, and version 15 is no exception. It comes as no surprise that PostgreSQL stands out as the most beloved and highly sought-after database in Stackoverflow’s recent developer survey.
Additionally, it ranks as one of the fastest-growing in popularity according to DB-Engines. What’s crucial, though, is grasping which features can be harnessed to optimize PostgreSQL for your specific use case, ensuring it performs at its best. ClusterControl will always support newest version of PostgreSQL database, so customer can use the latest version for deployment, monitoring and operations of the database.
The post What’s new in PG15 appeared first on Severalnines.
The post What’s new in PG15 appeared first on MariaDB.org.
]]>The post Creating a Standby Cluster With the Percona Operator for PostgreSQL appeared first on MariaDB.org.
]]>The post Creating a Standby Cluster With the Percona Operator for PostgreSQL appeared first on MariaDB.org.
]]>The post High Availability and Resiliency in Databases with MaxScale appeared first on MariaDB.org.
]]>The post High Availability and Resiliency in Databases with MaxScale appeared first on MariaDB.org.
]]>The post Galera Cluster for MySQL 8.0.36 released appeared first on MariaDB.org.
]]>There have been some notable changes in the Galera replication library 4.18. We fixed bugs around garbd: we noticed hangs due to exceptions in the GCS layer not being caught, and now we have a graceful exit; when SSL is used, and there are graceful node shutdowns, garbd can crash, thus making the cluster non-Primary – this is now also fixed. We deprecated socket_ssl_compression and while it doesn’t get set any longer, you, the user will receive a warning if it is explicitly set. We do not consider this option functional. Commit cut tracking on node leaving has been fixed, however the GCS protocol version had to be bumped for backwards compatibility. We now ensure that the gcomm join process is run within the gcomm service thread.
In MySQL 8.0.36-26.17, a notable fix ensures the --wsrep-recover option can accurately recover the GTID from log files that contain non-text bytes. For CLONE SST, improvements include reading port settings from my.cnf if not explicitly set in wsrep_sst_address, a switch to caching_sha2_password for user creation during SST (moving away from mysql_native_password), and enhanced diagnostic messages, especially in SSL contexts. Diagnostic capabilities have been expanded to include transaction sequence numbers and source IDs for ignored errors, alongside more precise logging for row-based replication buffer file creation and doublewrite recovery, contingent on wsrep_debug settings.
In an effort to standardize Total Order Isolation (TOI) error voting, the cluster now relies solely on MySQL error codes. This change aims to mitigate inconsistencies stemming from locale differences and non-deterministic execution paths, though it necessitates a bump in the wsrep protocol version to ensure backward compatibility, and prevent cluster splits during upgrades. Moreover, a combination of native deadlock and BF abort scenarios in stored procedures, which previously resulted in assertion failures, has been addressed by refining the error handling process to ignore wsrep BF abort error for sub-statements until after their execution. Fixes were implemented for autocommit in SELECT FOR UPDATE queries to prevent BF abort-induced inconsistencies and assertions within InnoDB, alongside improvements in error handling for such queries within transactions.
Please download the latest software and update your Galera Clusters! We continue to provide repositories for popular Linux distributions, and we encourage you to use them. Contact us more more information about what Galera Cluster Enterprise Edition can do for you.
The post Galera Cluster for MySQL 8.0.36 released appeared first on MariaDB.org.
]]>The post Why Your Next MySQL Database Should Not Be a MySQL Database appeared first on MariaDB.org.
]]> MySQL is a very popular database and a good choice for new projects. But is it the best choice?Luckily you have several options for this choice.MySQL Community vs. Enterprise EditionsTraditionally, the MySQL Community Edition has been a mainstay in the open source community for decades, and it is available for free. Originally, MariaDB was a […]
The post Why Your Next MySQL Database Should Not Be a MySQL Database appeared first on MariaDB.org.
]]>The post Open Door MongoDB Chats appeared first on MariaDB.org.
]]>The post Open Door MongoDB Chats appeared first on MariaDB.org.
]]>The post The Impact of Log File Synchronization on InnoDB Performance and Durability appeared first on MariaDB.org.
]]>fsync() or similar system calls to flush data to disk is a necessary step for ensuring durability. However, the efficiency of these calls depends on the operating system and the filesystem, potentially introducing latency.innodb_log_buffer_size, innodb_flush_log_at_trx_commit, and innodb_log_file_size), administrators can tune the balance between durability, performance, and throughput based on specific application needs.In summary, log file synchronization is a balancing act between ensuring data durability and maximizing performance. Through careful configuration and tuning of the InnoDB log system, it’s possible to achieve an optimal balance that meets the application’s needs for both reliability and speed. Understanding and optimizing these aspects are key to maintaining high-performing and resilient MySQL databases.
The post The Impact of Log File Synchronization on InnoDB Performance and Durability appeared first on The WebScale Database Infrastructure Operations Experts in PostgreSQL, MySQL, MariaDB and ClickHouse.
The post The Impact of Log File Synchronization on InnoDB Performance and Durability appeared first on MariaDB.org.
]]>The post Managing Excessive Growth of pg_wal in PostgreSQL: Causes and Solutions appeared first on MariaDB.org.
]]>pg_wal directory (formerly known as pg_xlog in versions before PostgreSQL 10) is a crucial component of PostgreSQL, storing Write-Ahead Logging (WAL) files. These files are essential for data durability and crash recovery, as they record all changes made to the database. However, it’s not uncommon for administrators to notice the pg_waldirectory’s size growing significantly, which can raise concerns about disk space and overall PostgreSQL management. Here are several reasons why your pg_wal might keep growing and what you can do about it:
PostgreSQL relies on a process to archive or remove old WAL files that are no longer needed for crash recovery. If this process is not correctly configured or if it fails, WAL files can accumulate, leading to growth in the pg_wal directory.
Solution: Ensure that WAL archiving is properly set up or that the wal_keep_segments parameter is appropriately configured to limit the number of WAL files retained. Also, verify that any custom cleanup scripts or tools are functioning as expected.
In a replication setup, the primary server retains WAL files until they have been successfully replicated to all standby servers. A significant replication lag could prevent the cleanup of WAL files on the primary.
Solution: Monitor replication lag and investigate any delays. Improving network throughput, adjusting replication settings, or troubleshooting standby server issues can help reduce lag and allow for normal WAL file removal.
WAL files must be kept for the duration of open transactions because they might be needed for rollback or crash recovery. Long-running transactions can prevent the cleanup of WAL files that were generated after the transaction started.
Solution: Identify and terminate long-running transactions that are not essential. Adjust application logic to avoid long transactions when possible.
PostgreSQL performs checkpoints to flush data from memory to disk, allowing WAL files to be recycled or removed afterward. Inadequate checkpoint settings can lead to excessive WAL file accumulation.
Solution: Review and adjust checkpoint-related parameters (checkpoint_timeout, max_wal_size, min_wal_size, etc.) to ensure timely checkpoints without overloading the system.
If WAL archiving is part of your backup strategy but fails or is incorrectly configured, WAL files will accumulate because they are not being successfully archived.
Solution: Check the WAL archiving configuration and logs for errors. Ensure that the archive command specified in archive_command is working as intended and that there’s sufficient storage space for the archives.
Certain database activities, such as bulk data loading, large-scale updates, or index creation, can generate a large amount of WAL data in a short period.
Solution: Schedule high-WAL activities during off-peak hours if possible. Consider using techniques that generate less WAL, such as unlogged tables for temporary data or bulk loading data with minimal logging.
Regular monitoring of the pg_wal directory and understanding the factors contributing to its growth are essential for effective PostgreSQL management. Employing monitoring tools, adjusting PostgreSQL configurations based on database workload, and ensuring healthy replication and backup practices can prevent undesired pg_wal growth and safeguard your database’s performance and disk space utilization.
The post Managing Excessive Growth of pg_wal in PostgreSQL: Causes and Solutions appeared first on The WebScale Database Infrastructure Operations Experts in PostgreSQL, MySQL, MariaDB and ClickHouse.
The post Managing Excessive Growth of pg_wal in PostgreSQL: Causes and Solutions appeared first on MariaDB.org.
]]>The post Preventing Broken Foreign Keys in PostgreSQL: Causes and Solutions appeared first on MariaDB.org.
]]>PostgreSQL allows the temporary disabling of foreign key checks for the duration of a session or transaction. This is sometimes done for performance reasons during bulk data loading. If foreign key constraints are not re-enabled or if the data is not validated after such operations, it can lead to broken foreign keys.
SET session_replication_role = 'replica';
-- Perform data operations that might violate FK constraints
SET session_replication_role = 'origin';
When restoring individual tables from a backup without restoring their related tables, there’s a risk of ending up with foreign keys that reference non-existent primary keys. This usually requires careful management of backup and restore procedures to ensure relational integrity is maintained across tables.
Direct updates or deletions to foreign key columns that bypass the foreign key constraints can lead to broken references. This might happen due to direct database modifications using tools or scripts that do not enforce foreign key constraints.
Importing data from external sources without validating foreign key constraints can introduce inconsistencies. This is common when data is inserted programmatically into the database from files or external systems without thorough validation.
Incorrectly configured ON DELETE or ON UPDATE cascade actions can unintentionally remove or alter referenced keys, leading to broken foreign keys. It’s important to understand the cascade behaviors and ensure they are correctly applied to maintain referential integrity.
Though rare, bugs in PostgreSQL itself or in the tools used to manage PostgreSQL databases can lead to situations where foreign key constraints are not correctly enforced. Staying updated with the latest patches and versions helps mitigate this risk.
PostgreSQL supports deferring constraint checks until the end of a transaction. If transactions are not properly managed, or if deferred constraints are not checked before transaction commit, this can lead to broken foreign keys.
SET CONSTRAINTS ALL DEFERRED;
-- Perform operations that temporarily violate FK constraints
-- Constraints are checked at transaction commit time
COMMIT;
While PostgreSQL strives to maintain data integrity through the enforcement of foreign keys, understanding the scenarios that can lead to broken foreign keys and taking proactive measures to prevent them is crucial for database administrators.
The post Preventing Broken Foreign Keys in PostgreSQL: Causes and Solutions appeared first on The WebScale Database Infrastructure Operations Experts in PostgreSQL, MySQL, MariaDB and ClickHouse.
The post Preventing Broken Foreign Keys in PostgreSQL: Causes and Solutions appeared first on MariaDB.org.
]]>The post Optimizing Query Performance: Tips for Troubleshooting PostgreSQL Statistics and Cost Estimation appeared first on MariaDB.org.
]]>PostgreSQL relies on statistical information about tables to plan queries. These statistics can become outdated as the data changes, leading to suboptimal query plans.
ANALYZE command to update statistics for a table, or VACUUM ANALYZE to also reclaim storage and update statistics.
ANALYZE tablename;
PostgreSQL’s planner may not accurately estimate the selectivity of queries involving columns that are statistically correlated. Creating extended statistics can help:
CREATE STATISTICS stat_name (dependencies) ON column1, column2 FROM tablename;
After creating them, run ANALYZE to populate the statistics.
The default_statistics_target parameter sets the level of detail of the statistics gathered by ANALYZE. Increasing this value can improve the planner’s estimates at the cost of longer analysis times and more space consumption.
postgresql.conf
default_statistics_target = 100; -- Increase as needed
ALTER TABLE tablename ALTER COLUMN columnname SET STATISTICS 1000;
PostgreSQL’s planner makes decisions based on cost estimations of different operations like disk I/O, CPU usage, and row fetching. Review and adjust the cost settings in postgresql.conf if the defaults don’t align with your actual hardware performance.
seq_page_cost: Cost of a sequential disk page read.random_page_cost: Cost of a non-sequential disk page read.cpu_tuple_cost: Cost of processing each row.The EXPLAIN and EXPLAIN ANALYZE commands are invaluable for troubleshooting. They show the execution plan of a query and, with EXPLAIN ANALYZE, the actual execution statistics.
The planner’s estimates can be less accurate for parameterized queries due to generic plan caching. Use PREPARE and EXECUTE with caution and monitor their performance.
Log and review slow queries regularly to spot patterns or frequent operations that may benefit from statistics or cost parameter adjustments.
log_min_duration_statement = 500; -- Log queries taking longer than 500ms
For complex queries involving multiple joins or set operations, try rewriting the query or forcing a specific join method to see if performance improves.
Effective troubleshooting of statistics and cost estimation in PostgreSQL involves a combination of regularly updating statistics, fine-tuning the database configuration, and deep analysis using the EXPLAIN command. By taking a proactive approach to monitoring and optimization, you can significantly enhance query performance and ensure that your PostgreSQL database runs efficiently.
The post Optimizing Query Performance: Tips for Troubleshooting PostgreSQL Statistics and Cost Estimation appeared first on The WebScale Database Infrastructure Operations Experts in PostgreSQL, MySQL, MariaDB and ClickHouse.
The post Optimizing Query Performance: Tips for Troubleshooting PostgreSQL Statistics and Cost Estimation appeared first on MariaDB.org.
]]>The post Enhancements in PostgreSQL 16 Query Planner/Optimizer: Boosting Performance, Scalability, and Reliability appeared first on MariaDB.org.
]]>These improvements make PostgreSQL 16 an even more compelling choice for applications that demand high performance, scalability, and reliability from their database systems.
The post Enhancements in PostgreSQL 16 Query Planner/Optimizer: Boosting Performance, Scalability, and Reliability appeared first on The WebScale Database Infrastructure Operations Experts in PostgreSQL, MySQL, MariaDB and ClickHouse.
The post Enhancements in PostgreSQL 16 Query Planner/Optimizer: Boosting Performance, Scalability, and Reliability appeared first on MariaDB.org.
]]>The post Optimizing PostgreSQL: A Guide to Troubleshooting Long-Running Queries and Wait Events appeared first on MariaDB.org.
]]>First, identify the long-running queries using the pg_stat_activity view. This view shows all active queries and their run times:
SELECT pid, query, state, now() - query_start AS duration, wait_event_type, wait_event
FROM pg_stat_activity
WHERE state = 'active'
ORDER BY duration DESC;
This gives you a list of active queries ordered by their execution time, allowing you to focus on the longest-running ones.
Wait events in the pg_stat_activity view can indicate what the query is waiting on, such as locks, IO, etc.:
wait_event_type is Lock, the query is waiting for a lock. You can then investigate which table or row is causing the lock wait.DataFileRead or DataFileWrite, suggesting the query is slowed down by disk IO.For lock-related wait events, identify blocking sessions:
SELECT
pid,
usename AS username,
query AS sql_text,
state,
wait_event_type AS event_type,
wait_event,
backend_start AS logon_time,
state_change AS last_state_change,
EXTRACT(EPOCH FROM (now() - query_start))::INT AS seconds_since_query_start,
query_start,
client_addr AS client_address,
client_hostname,
client_port,
application_name
FROM pg_stat_activity
WHERE state = 'active'
AND query NOT LIKE '%pg_stat_activity%'
ORDER BY seconds_since_query_start DESC
This query helps in identifying which queries are blocking others, a common cause of long-running queries.
Application logs can provide context for long-running queries, such as which operations triggered them and any errors or warnings that were logged. This is crucial for understanding the application behavior that leads to problematic queries.
For identified long-running queries, use the EXPLAIN and EXPLAIN ANALYZE commands to get the execution plan and runtime statistics:
EXPLAIN ANALYZE SELECT ...
This helps in understanding how PostgreSQL executes the query, which parts of the query are most time-consuming, and whether the query planner’s assumptions match reality.
Monitoring the number and types of active sessions can offer insights into overall system load and specific user or application behaviors contributing to performance issues. Use pg_stat_activity to monitor sessions, and consider using tools or extensions that provide more detailed monitoring and historical data.
Based on the insights gathered, consider applying optimizations such as:
Review and adjust PostgreSQL configuration settings related to memory usage, parallelism, and IO, based on the performance analysis. Tools like pgtune can provide a good starting point for configuration adjustments.
Based on application log analysis and query behavior, implement necessary changes in the application to prevent long-running queries. This might include optimizing data access patterns, caching, or modifying how data is queried and processed.
Troubleshooting long-running queries in PostgreSQL involves a comprehensive approach that combines database insights with application context. Identifying wait events and analyzing execution plans are key steps in diagnosing the issue. Additionally, understanding the application behavior and session activity provides a complete picture necessary for effective optimization and performance improvement.
The post Optimizing PostgreSQL: A Guide to Troubleshooting Long-Running Queries and Wait Events appeared first on The WebScale Database Infrastructure Operations Experts in PostgreSQL, MySQL, MariaDB and ClickHouse.
The post Optimizing PostgreSQL: A Guide to Troubleshooting Long-Running Queries and Wait Events appeared first on MariaDB.org.
]]>The post Implementing the Materialized Path Model in PostgreSQL: A Step-by-Step Guide appeared first on MariaDB.org.
]]>First, create a table to hold the hierarchical data. For this example, let’s model a simple category structure for products:
CREATE TABLE categories (
    category_id SERIAL PRIMARY KEY,
    category_name VARCHAR(255) NOT NULL,
    path TEXT NOT NULL,
    CONSTRAINT path_unique UNIQUE (path)
);
Here, path stores the materialized path for each category. A common convention is to use a delimiter, such as ‘/’, to separate IDs in the path string.
Insert data into the table, constructing the path value to represent each category’s position in the hierarchy. For a root category, the path might simply be its own category_id, while subcategories would append their category_id to their parent’s path.
-- Insert a root category
INSERT INTO categories (category_name, path) VALUES ('Electronics', '1/');

-- Insert a subcategory under 'Electronics'
INSERT INTO categories (category_name, path) VALUES ('Laptops', '1/2/');
To get all ancestors of a category, you can use the LIKE operator:
SELECT * FROM categories WHERE '1/2/' LIKE path || '%';
To get all descendants (children, grandchildren, etc.) of a category:
SELECT * FROM categories WHERE path LIKE '1/%';
Consider a hierarchy where “Electronics” is a root category, with “Laptops” and “Smartphones” as subcategories. Under “Laptops”, there might be “Gaming” and “Ultrabooks” as further subcategories.
-- Root category
INSERT INTO categories (category_name, path) VALUES ('Electronics', '1/');

-- Direct child categories
INSERT INTO categories (category_name, path) VALUES ('Laptops', '1/2/');
INSERT INTO categories (category_name, path) VALUES ('Smartphones', '1/3/');

-- Subcategories under 'Laptops'
INSERT INTO categories (category_name, path) VALUES ('Gaming', '1/2/4/');
INSERT INTO categories (category_name, path) VALUES ('Ultrabooks', '1/2/5/');
path column can significantly improve query performance, especially for tables with large hierarchies.The Materialized Path model offers a straightforward and efficient method for managing hierarchical data in PostgreSQL, making it a suitable choice for various applications requiring hierarchical data representation.
The post Implementing the Materialized Path Model in PostgreSQL: A Step-by-Step Guide appeared first on The WebScale Database Infrastructure Operations Experts in PostgreSQL, MySQL, MariaDB and ClickHouse.
The post Implementing the Materialized Path Model in PostgreSQL: A Step-by-Step Guide appeared first on MariaDB.org.
]]>The post Addressing Performance Bottlenecks in UPDATE and DELETE Intensive PostgreSQL Applications appeared first on MariaDB.org.
]]>UPDATE and DELETE operations can become epicenters of performance bottlenecks in PostgreSQL, even with optimal indexing in place. This is due to several underlying factors associated with how PostgreSQL manages data and transactions, as well as the impact of these operations on the database structure and indexing mechanism. Understanding these factors is crucial for diagnosing and mitigating performance issues in such environments:
PostgreSQL uses MVCC to handle concurrency, allowing transactions to view database snapshots as they were at the start of the transaction, thereby providing non-blocking reads. While MVCC enables high levels of concurrency, it introduces overhead for UPDATE and DELETE operations:
UPDATE and DELETE operations create new versions of tuples (rows), marking the old ones as obsolete. These obsolete tuples accumulate over time, leading to table bloat until vacuumed.UPDATE and DELETE operation requires corresponding updates in all indexes associated with the table. This not only increases the write load but also leads to index bloat, where indexes contain pointers to obsolete tuples.UPDATE and DELETE operations leads to write amplification, significantly increasing I/O operations. This can degrade performance, especially on storage systems with limited I/O capacity or high latency.UPDATE and DELETE operations acquire row-level locks, which, in high-concurrency environments, can lead to locking contention, blocking queries, and even deadlocks if not carefully managed.UPDATE/DELETEintensive workloads. These transactions can hold locks for extended periods, blocking other operations and leading to performance degradation.UPDATE and DELETE operations can lead to physical table fragmentation, where table data becomes scattered across the disk. This fragmentation can result in inefficient disk I/O as the storage system needs to seek more extensively to retrieve contiguous data blocks.Addressing performance bottlenecks in UPDATE and DELETE intensive applications requires a multifaceted approach:
UPDATE and DELETE operations within smaller, more manageable data subsets, reducing index maintenance overhead and improving vacuum efficiency.UPDATE and DELETE operations to minimize locking and transaction overhead. Use techniques like CTEs for more efficient bulk updates.Understanding the underlying challenges of UPDATE and DELETE operations in PostgreSQL and implementing a combination of design, maintenance, and tuning strategies can significantly mitigate performance bottlenecks in such workloads.
The post Addressing Performance Bottlenecks in UPDATE and DELETE Intensive PostgreSQL Applications appeared first on The WebScale Database Infrastructure Operations Experts in PostgreSQL, MySQL, MariaDB and ClickHouse.
The post Addressing Performance Bottlenecks in UPDATE and DELETE Intensive PostgreSQL Applications appeared first on MariaDB.org.
]]>The post Key Considerations for Optimizing and Managing PostgreSQL Indexes appeared first on MariaDB.org.
]]>PostgreSQL supports several types of indexes, each optimized for specific types of queries:
While indexes can significantly improve query performance, they also introduce overhead:
You can create indexes on a subset of a table’s rows using a WHERE clause. Partial indexes are smaller and faster than indexes on the entire table, and they are useful when queries only affect a subset of rows.
CREATE INDEX idx_partial ON my_table (my_column) WHERE my_column IS NOT NULL;
Indexes can include multiple columns. The order of columns matters and should match the most common query patterns. However, adding too many columns can make the index less efficient due to increased size and complexity.
CREATE INDEX idx_multicolumn ON my_table (column1, column2);
Indexes on foreign key columns and columns frequently used in JOIN conditions can significantly improve performance by speeding up row matching.
Regularly review index usage to ensure they are providing the intended performance benefits. PostgreSQL provides tools like pg_stat_user_indexes and pg_stat_all_indexes views for monitoring index usage and identifying unused or duplicate indexes.
An index-only scan occurs when a query can be satisfied entirely by the index without having to look up the corresponding table row. This can happen if all the columns queried are part of the index. Designing indexes to support index-only scans can greatly improve query performance.
By default, B-tree indexes do not store NULL values, except for multicolumn indexes where at least one column is non-NULL. This behavior can affect query performance and results, especially with partial indexes designed around NULL conditions.
Use the EXPLAIN command to analyze how queries use indexes. This can provide insights into whether the optimizer is using the indexes as expected and help identify opportunities for further optimization.
Over time, indexes can become bloated or fragmented, especially with frequent writes. Use maintenance operations like REINDEX, or consider tools like pg_repack, to rebuild indexes and restore their efficiency.
Remembering these key points about PostgreSQL indexes can help you design a well-optimized database that balances performance improvements from indexing against the costs of index maintenance and overhead.
The post Key Considerations for Optimizing and Managing PostgreSQL Indexes appeared first on The WebScale Database Infrastructure Operations Experts in PostgreSQL, MySQL, MariaDB and ClickHouse.
The post Key Considerations for Optimizing and Managing PostgreSQL Indexes appeared first on MariaDB.org.
]]>The post What’s new in MariaDB Connector/Node.js 3.3 appeared first on MariaDB.org.
]]>The post What’s new in MariaDB Connector/Node.js 3.3 appeared first on MariaDB.org.
]]>The post MariaDB Galera Cluster – the wsrep allowlist appeared first on MariaDB.org.
]]>MariaDB [mysql]> show tables like 'wsrep%'; +--------------------------+ | Tables_in_mysql (wsrep%) | +--------------------------+ | wsrep_allowlist | | wsrep_cluster | | wsrep_cluster_members | | wsrep_streaming_log | +--------------------------+ 4 rows in set (0.000 sec)
It is the wsrep_allowlist table, which stores the allowed IP addresses that can perform an IST/SST, in a comma delimited format. Before the introduction of wsrep_allowlist, as long as a node has access to Galera Cluster’s TCP ports, it an make an SST/IST request, without authentication being performed; some users prefer to have a method to make this more robust, and secure, hence with wsrep_allowlist only if the JOINER node is in the IP list, will it be allowed to join the cluster.
You can either have IPv4 or IPv6 addresses for wsrep_allowlist, but it does not allow wildcard IPs or hostnames. It was implemented in MDEV-27246.
MariaDB [mysql]> describe wsrep_allowlistG
*************************** 1. row ***************************
  Field: ip
   Type: char(64)
   Null: NO
    Key: PRI
Default: NULL
  Extra:
1 row in set (0.001 sec)
Altering it is as simple as executing: insert into mysql.wsrep_allowlist(ip) values('18.193.102.155'); and you will end up seeing something like:
MariaDB [mysql]> select * from wsrep_allowlist;
+----------------+
| ip             |
+----------------+
| 18.193.102.155 |
| 18.194.147.243 |
+----------------+
2 rows in set (0.000 sec)
And when another node tries to get connected, the potential DONOR nodes will see this in the error.log:
2024-03-18 8:19:02 0 [Warning] WSREP: Connection not allowed, IP 3.70.155.51 not found in allowlist.
And naturally, on the node trying to be the JOINER not in the allowlist, an error such as the following should be easily notable:
2024-03-18  8:19:14 0 [ERROR] WSREP: failed to open gcomm backend connection: 110: failed to reach primary view: 110 (Connection timed out)
	 at ./gcomm/src/pc.cpp:connect():160
2024-03-18  8:19:14 0 [ERROR] WSREP: ./gcs/src/gcs_core.cpp:gcs_core_open():221: Failed to open backend connection: -110 (Connection timed out)
2024-03-18  8:19:15 0 [ERROR] WSREP: ./gcs/src/gcs.cpp:gcs_open():1674: Failed to open channel 'mariadb' at 'gcomm://18.194.147.243,18.193.102.155': -110 (Connection timed out)
2024-03-18  8:19:15 0 [ERROR] WSREP: gcs connect failed: Connection timed out
2024-03-18  8:19:15 0 [ERROR] WSREP: wsrep::connect(gcomm://18.194.147.243,18.193.102.155) failed: 7
Adding the remaining node to the allowlist fixes this:
MariaDB [mysql]> insert into mysql.wsrep_allowlist(ip) values('3.70.155.51');
Query OK, 1 row affected (0.002 sec)

MariaDB [mysql]> select * from wsrep_allowlist;
+----------------+
| ip             |
+----------------+
| 18.193.102.155 |
| 18.194.147.243 |
| 3.70.155.51    |
+----------------+
3 rows in set (0.000 sec)
And now we are back to having a 3-node MariaDB Galera Cluster. There is some documentation at MariaDB on wsrep_allowlist, but we hope this blog post helps you get going quicker as it has a practical example.
Did you know about this cool MariaDB Galera Cluster feature? Will you be using it? Can you wait for when it is ported into Galera Cluster for MySQL?
Don’t forget to join our upcoming webinar on MariaDB: Top tips to drive your MariaDB Galera Cluster performance with new features.
The post MariaDB Galera Cluster – the wsrep allowlist appeared first on MariaDB.org.
]]>The post Webinar: Top tips to drive your MariaDB Galera Cluster performance with new features appeared first on MariaDB.org.
]]>So where does MariaDB Galera Cluster stand out compared to the rest? Here are a few selected features that may pique your interest:
* Galera 4 is standard in MariaDB Galera Cluster since MariaDB Server 10.4. Note that Galera Cluster is built-into MariaDB Server.
* The `mysql` database contains new tables: `wsrep_cluster`, `wsrep_cluster_members`, `wsrep_streaming_log`, and `wsrep_allowlist`.
* Streaming replication allows replicating transactions of an unlimited size, i.e. greater than 2GB.
* GTID handling with Galera Cluster and MariaDB Server are synchronised, thus you have seamless replication of MariaDB GTIDs to other nodes in the cluster.
* `wsrep_mode` to help you replicate MyISAM, and Aria storage engines.
* You can migrate from unencrypted replication to TLS Galera communications without any downtime.
* A JSON interface for wsrep node state, including progress logging for State Snapshot Transfers (SSTs). This also includes the IP allowlist for Galera Cluster nodes that can make the requests (currently a unique feature to MariaDB Server).
* Rolling upgrades from MariaDB Server 10.4 to later, are supported.
There are plenty more, considering there are **enterprise only features** like the Blackbox for Galera troubleshooting, encrypting of the gcache, and more. While we are at it, we will also cover the MariaDB MaxScale features that are Galera Cluster specific.
Join us for a webinar to learn about all these features and how they help you with your Galera Cluster deployment.
JOIN EMEA WEBINAR 11th APRIL 13 PM CET
JOIN USA WEBINAR 11th APRIL 9 AM PST
The post Webinar: Top tips to drive your MariaDB Galera Cluster performance with new features appeared first on MariaDB.org.
]]>The post Coming up next, a ColumnStore webinar appeared first on MariaDB.org.
]]>We will be jumping into a live demo with some example data and queries simulating high volume time series workloads, and even a quick example of how ColumnStore fairs in the 1 billion row challenge.
We will create some tables to help you get familiar with the ColumnStore engine, then start loading data using techniques you may already be familiar with like LOAD DATA INFILE, while introducing cpimport and the advantages between them.
Once we have a schema loaded with data, we can begin querying the data to really show how ColumnStore shines with aggregate query performance. You will never want to create a data warehouse cube again!
Should you wish to get started yourself today with MariaDB ColumnStore; here at Vettabase we have begun our own mission to better understand and support ColumnStore. You may have read my previous post, where I detailed our initial efforts in creating updated Vagrant and Docker images for easy deployments using the community releases.
As well as our MariaDB ColumnStore Unofficial Documentation Project, which we also hope to open soon for contributions.
Signup for the webinar here, https://meet.zoho.eu/8Jg7lx7hZ8
See you in a few days,
Richard Bensley
The post Coming up next, a ColumnStore webinar appeared first on MariaDB.org.
]]>The post Make SHOW as good as SELECT even with InnoDB appeared first on MariaDB.org.
]]>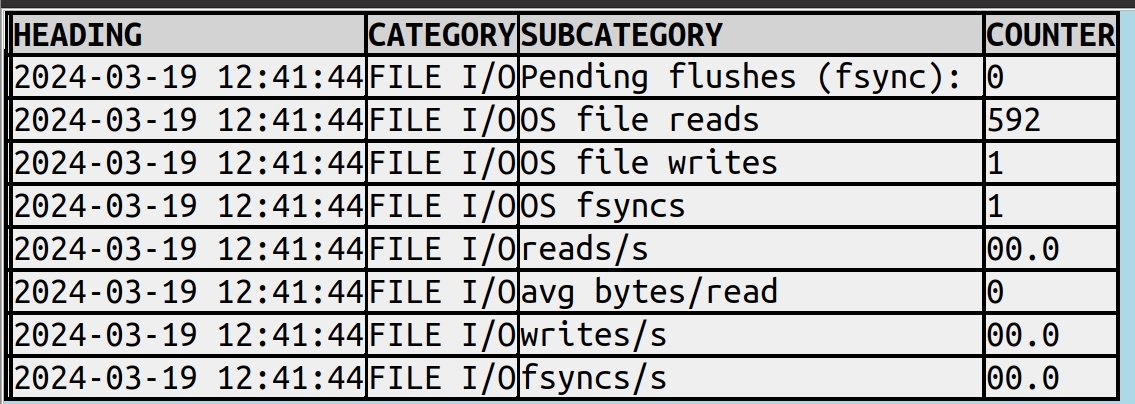
as opposed to what the server sends:
...
--------
FILE I/O
--------
Pending flushes (fsync): 0
295 OS file reads, 1 OS file writes, 1 OS fsyncs
0.00 reads/s, 0 avg bytes/read, 0.00 writes/s, 0.00 fsyncs/s
...
In my last post I described a way to
Make SHOW as good as SELECT”
which was possible because most result sets from SHOW etc. are at least table-like, but
STATUS’s wall of text isn’t table-like. So I forced it into a table with these basic rules:
After that there’s still a bunch of fiddling, I put the details in source-code comments.
The new features related to SHOW etc. are now in a released version as well as in source code,
downloadable from github.
In the rest of this post I’ll show a complete result from SHOW ENGINE INNODB STATUS; (“before”),
and the same data from SHOW ENGINE INNODB STATUS WHERE 1 > 0; after ocelot_statement_syntax_checker
has been set to ‘7’ (“after”). (Instead of copying the Grid Widget I copied from the History Widget
after setting Max Row Count to 100.)
| InnoDB |      |
=====================================
2024-03-19 12:39:45 0x7f80f01f3700 INNODB MONITOR OUTPUT
=====================================
Per second averages calculated from the last 43 seconds
-----------------
BACKGROUND THREAD
-----------------
srv_master_thread loops: 0 srv_active, 2455 srv_idle
srv_master_thread log flush and writes: 2454
----------
SEMAPHORES
----------
------------
TRANSACTIONS
------------
Trx id counter 754
Purge done for trx's n:o < 0 undo n:o < 0 state: running but idle
History list length 0
LIST OF TRANSACTIONS FOR EACH SESSION:
---TRANSACTION (0x7f8111334680), not started
0 lock struct(s), heap size 1128, 0 row lock(s)
---TRANSACTION (0x7f8111333b80), not started
0 lock struct(s), heap size 1128, 0 row lock(s)
--------
FILE I/O
--------
Pending flushes (fsync): 0
295 OS file reads, 1 OS file writes, 1 OS fsyncs
0.00 reads/s, 0 avg bytes/read, 0.00 writes/s, 0.00 fsyncs/s
---
LOG
---
Log sequence number 463193
Log flushed up to   463193
Pages flushed up to 362808
Last checkpoint at  362808
----------------------
BUFFER POOL AND MEMORY
----------------------
Total large memory allocated 167772160
Dictionary memory allocated 853016
Buffer pool size   8064
Free buffers       7647
Database pages     417
Old database pages 0
Modified db pages  164
Percent of dirty pages(LRU & free pages): 2.033
Max dirty pages percent: 90.000
Pending reads 0
Pending writes: LRU 0, flush list 0
Pages made young 0, not young 0
0.00 youngs/s, 0.00 non-youngs/s
Pages read 273, created 144, written 0
0.00 reads/s, 0.00 creates/s, 0.00 writes/s
No buffer pool page gets since the last printout
Pages read ahead 0.00/s, evicted without access 0.00/s, Random read ahead 0.00/s
LRU len: 417, unzip_LRU len: 0
I/O sum[0]:cur[0], unzip sum[0]:cur[0]
--------------
ROW OPERATIONS
--------------
0 read views open inside InnoDB
state: sleeping
----------------------------
END OF INNODB MONITOR OUTPUT
============================
 |
/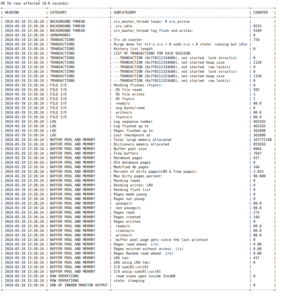
The post Make SHOW as good as SELECT even with InnoDB appeared first on MariaDB.org.
]]>The post MariaDB 11.5.0 preview release available appeared first on MariaDB.org.
]]>Continue reading “MariaDB 11.5.0 preview release available”
The post MariaDB 11.5.0 preview release available appeared first on MariaDB.org.
The post MariaDB 11.5.0 preview release available appeared first on MariaDB.org.
]]>The post Comparing Postgres and MySQL on the insert benchmark with a small server appeared first on MariaDB.org.
]]>The per-DBMS results are here for Postgres, InnoDB and MyRocks. Those posts also have links to the configurations and builds that I used. This post shares the same result but makes it easier to compare across DBMS.
Results here are from a small server (8 cores) with a low concurrency workload (1 client, <= 3 concurrent connections). Results from a larger server are pending and might not be the same as what I share here.
Summary of throughput for the IO-bound workload
The post Comparing Postgres and MySQL on the insert benchmark with a small server appeared first on MariaDB.org.
]]>The post Percona XtraBackup 8.0.28 Supports Encrypted Table Backups with AWS KMS appeared first on MariaDB.org.
]]> Percona XtraBackup (PXB) version 8.0.28 supports taking backups for the encrypted tables in your MySQL database using the AWS Key Management Service. For setting up data-at-rest encryption using AWS key management service, please see Configuring Keyring for Encryption Using AWS Key Management Service in Percona Server for MySQL.In this blog post, we will discuss how […]
The post Percona XtraBackup 8.0.28 Supports Encrypted Table Backups with AWS KMS appeared first on MariaDB.org.
]]>The post Yet another Insert Benchmark result: MyRocks, MySQL and a small server appeared first on MariaDB.org.
]]>tl;dr
The post Yet another Insert Benchmark result: MyRocks, MySQL and a small server appeared first on MariaDB.org.
]]>The post Yes another Insert Benchmark result: MySQL, InnoDB and a small server appeared first on MariaDB.org.
]]>tl;dr
The post Yes another Insert Benchmark result: MySQL, InnoDB and a small server appeared first on MariaDB.org.
]]>The post Release Roundup March 18, 2024 appeared first on MariaDB.org.
]]>The post Release Roundup March 18, 2024 appeared first on MariaDB.org.
]]>The post Trying to tune Postgres for the Insert Benchmark: small server appeared first on MariaDB.org.
]]>The results here are from Postgres 16.2 and a small server (8 CPU cores) with a low concurrency workload. Previous benchmark reports for Postgres on this setup are here for cached and IO-bound runs.
tl;dr
The l.i1 benchmark step deletes more rows/statement so the optimizer overhead is more significant on the l.i2 step. The ratios are much larger for InnoDB and MyRocks (they have perf problems, just not this perf problem).
I hope for a Postgres storage engine that provides MVCC without vacuum. In theory, more frequent vacuum might help and the perf overhead from frequent vacuum might be OK for the heap table given the usage of visibility bits. But when vacuum then has to do a full index scan (no visibility bits there) then that is a huge cost which limits vacuum frequency.
Build + Configuration
The post Trying to tune Postgres for the Insert Benchmark: small server appeared first on MariaDB.org.
]]>The post Identifying Performance Bottlenecks: Assessing IO Subsystem Reads in MySQL appeared first on MariaDB.org.
]]>High disk latency is a primary indicator of IO struggles. Use tools like iostat, vmstat, or atop on Linux systems to monitor disk read latency. Look for increased await and r_await times which suggest that read operations are taking longer than usual.
innodb_io_capacityThe innodb_io_capacity setting in MySQL determines the number of IO operations per second (IOPS) that InnoDB believes the disk can handle. If your actual disk IOPS is consistently near or exceeding this value, it might indicate that your disk is struggling to keep up with the workload. Adjust this setting based on your disk’s capabilities and workload requirements.
SHOW GLOBAL STATUS OutputThe SHOW GLOBAL STATUS command can provide insights into various IO-related metrics. Pay attention to:
Innodb_data_reads and Innodb_data_read: Increase in these values indicates higher read operations.Innodb_buffer_pool_reads: High values suggest that many reads had to access the disk directly because the needed data was not in the buffer pool.Innodb_buffer_pool_wait_free: Non-zero values indicate that InnoDB had to wait for clean pages to be written to disk before continuing.The InnoDB buffer pool is crucial for reducing disk IO by caching data and indexes. Key metrics include:
Innodb_buffer_pool_read_requests: Shows the number of requests to read a page.Innodb_buffer_pool_reads: Indicates the number of times a read had to go to disk.A low ratio of Innodb_buffer_pool_reads to Innodb_buffer_pool_read_requests suggests good buffer pool efficiency. A high ratio means the buffer pool may be too small or the workload is too large for the current configuration.
innodb_buffer_pool_size ConfigurationEnsure your innodb_buffer_pool_size is adequately sized for your dataset. A small buffer pool relative to your database size can lead to increased disk reads because less data can be cached in memory.
Long-running queries can also indicate IO struggles, especially if those queries involve large table scans or complex joins that are not optimized. Use the MySQL Slow Query Log to identify and optimize such queries.
MySQL’s Performance Schema and Sys Schema (a collection of views, functions, and procedures to simplify Performance Schema usage) can help diagnose IO issues. For instance, you can query file I/O events to see detailed file-level IO activity.
Lastly, consider your hardware. SSDs significantly reduce read latency compared to traditional HDDs. Ensure your hardware is suitable for your database’s IO demands.
By combining these approaches, you can get a comprehensive view of your MySQL IO subsystem’s health, especially concerning read operations. Addressing issues in IO can involve query optimization, hardware upgrades, or MySQL configuration adjustments.
The post Identifying Performance Bottlenecks: Assessing IO Subsystem Reads in MySQL appeared first on The WebScale Database Infrastructure Operations Experts in PostgreSQL, MySQL, MariaDB and ClickHouse.
The post Identifying Performance Bottlenecks: Assessing IO Subsystem Reads in MySQL appeared first on MariaDB.org.
]]>The post Optimizing PostgreSQL Performance: Navigating the Use of Bind Variables in PostgreSQL 16 appeared first on MariaDB.org.
]]>Bind variables are incredibly useful for optimizing database interactions, but their overuse can introduce some challenges:
Given the absence of a hard limit on the number of bind variables, developers must use judgment and best practices to determine the appropriate number:
work_mem and maintenance_work_mem, can help accommodate queries with a large number of bind variables more effectively.In PostgreSQL 16, while there is no explicit upper limit on the number of bind variables you can use, the practical limit is influenced by the specifics of your application, database design, and server capabilities. The key to effectively using bind variables is to balance their benefits in security and performance optimization against the potential overhead they introduce when used in large numbers. By adhering to best practices in query design, system configuration, and performance testing, developers can make informed decisions on the appropriate use of bind variables in their PostgreSQL applications.
The post Optimizing PostgreSQL Performance: Navigating the Use of Bind Variables in PostgreSQL 16 appeared first on The WebScale Database Infrastructure Operations Experts in PostgreSQL, MySQL, MariaDB and ClickHouse.
The post Optimizing PostgreSQL Performance: Navigating the Use of Bind Variables in PostgreSQL 16 appeared first on MariaDB.org.
]]> Functionality of dbstat
How does dbstat work
How to install dbstat
Query dbstat
table_size
processlist
trx_and_lck
metadata_lock
global_variables
global_status
Testing
Sources
An idea that I have been thinking about for a long time and have now, thanks to a customer, finally tackled is dbstat for MariaDB/MySQL. The idea is based on sar/sysstat by Sebastien Godard:
sar - Collect, report, or save system activity information.
and Oracle Statspack:
Statspack is a performance tuning tool ... to quickly gather detailed analysis of the performance of that database instance.
Functionality of dbstat
Although we have had the performance schema for some time, it does not cover some points that we see as a problem in practice and that are requested by customers:
The table_size module collects data on the growth of tables. This allows statements to be made about the growth of individual tables, databases, future MariaDB Catalogs or the entire instance. This is interesting for users who are using multi-tenant systems or are otherwise struggling with uncontrolled growth.
The processlist module takes a snapshot of the process list at regular intervals and saves it. This information is useful for post-mortem analyses if the user was too slow to save his process list or to understand how a problem has built up.
The problem is often caused by long-running transactions, row locks or metadata locks. These are recorded and saved by the trx_and_lck and metadata_lock modules. This means that we can see problems that we did not even notice before or we can see what led to the problem after the accident (analogous to a tachograph in a vehicle).
Another question that we sometimes encounter in practice is: When was which database variable changed and what did it look like before? This is covered by the global_variables module. Unfortunately, it is not possible to find out who changed the variable or why. Operational processes are required for this.
The last module, global_status, actually covers what sar/sysstat does. It collects the values from SHOW GLOBAL STATUS; and saves them for later analysis purposes or to simply create graphs.
How does dbstat work
dbstat uses the database Event Scheduler as a scheduler. This must first be switched on for MariaDB (event_scheduler = ON). With MySQL it is already switched on by default. The Event Scheduler has the advantage that we can activate the jobs at a finer granularity, for example 10 s, which would not be possible with the crontab.
The Event Scheduler then executes SQL/PSM code to collect the data on the one hand and to delete the data on the other, so that the dbstat database does not grow immeasurably.
The following jobs are currently planned:
ModuleCollectDeleteQuantity structureRemarks
table_size1/d at 02:0412/h, 1000 rows, > 31 d1000 tab × 31 d = 31k rowsShould work up to 288k tables.
processlist1/min1/min, 1000 rows, > 7 d1000 con × 1440 min × 7 d = 10M rowsShould work up to 1000 concurrent connections.
trx_and_lck1/min1/min, 1000 rows, > 7 d100 lck × 1440 min × 7 d = 1M rowsDepends very much on the application.
metadata_lock1/min12/h, 1000 rows, > 30 d100 mdl × 1440 × 30 d = 4M rowsDepends very much on the application.
global_variables1/minnever1000 rowsNormally this table should not grow.
global_status1/min1/min, 1000 rows, > 30 d1000 rows × 1440 × 30 d = 40MRows Can become large?
How to install dbstat
dbstat can be downloaded from Github and is licensed under GPLv2.
The installation is simple: First execute the SQL file create_user_and_db.sql. Then execute the corresponding create_*.sql files for the respective modules in the dbstat database. There are currently no direct dependencies between the modules. If you want to use a different user or a different database than dbstat, you have to take care of this yourself.
Query dbstat
Some possible queries on the data have already been prepared. They can be found in the query_*.sql files. Here are a few examples:
table_size
SELECT `table_schema`, `table_name`, `ts`, `table_rows`, `data_length`, `index_length`
FROM `table_size`
WHERE `table_catalog` = \'def\'
AND `table_schema` = \'dbstat\'
AND `table_name` = \'table_size\'
ORDER BY `ts` ASC
;
+--------------+------------+---------------------+------------+-------------+--------------+
| table_schema | table_name | ts | table_rows | data_length | index_length |
+--------------+------------+---------------------+------------+-------------+--------------+
| dbstat | table_size | 2024-03-09 20:01:00 | 0 | 16384 | 16384 |
| dbstat | table_size | 2024-03-10 17:26:33 | 310 | 65536 | 16384 |
| dbstat | table_size | 2024-03-11 08:28:12 | 622 | 114688 | 49152 |
| dbstat | table_size | 2024-03-12 08:02:38 | 934 | 114688 | 49152 |
| dbstat | table_size | 2024-03-13 08:08:55 | 1247 | 278528 | 81920 |
+--------------+------------+---------------------+------------+-------------+--------------+
processlist
SELECT connection_id, ts, time, state, SUBSTR(REGEXP_REPLACE(REPLACE(query, \"n\", \' \'), \' +\', \' \'), 1, 64) AS query
FROM processlist
WHERE command != \'Sleep\'
AND connection_id = @connection_id
ORDER BY ts ASC
LIMIT 5
;
+---------------+---------------------+---------+---------------------------------+---------------------------------------------+
| connection_id | ts | time | state | query |
+---------------+---------------------+---------+---------------------------------+---------------------------------------------+
| 14956 | 2024-03-09 20:21:12 | 13.042 | Waiting for table metadata lock | update test set data = \'bla\' where id = 100 |
| 14956 | 2024-03-09 20:22:12 | 73.045 | Waiting for table metadata lock | update test set data = \'bla\' where id = 100 |
| 14956 | 2024-03-09 20:23:12 | 133.044 | Waiting for table metadata lock | update test set data = \'bla\' where id = 100 |
| 14956 | 2024-03-09 20:24:12 | 193.044 | Waiting for table metadata lock | update test set data = \'bla\' where id = 100 |
| 14956 | 2024-03-09 20:25:12 | 253.041 | Waiting for table metadata lock | update test set data = \'bla\' where id = 100 |
+---------------+---------------------+---------+---------------------------------+---------------------------------------------+
trx_and_lck
SELECT * FROM trx_and_lckG
*************************** 1. row ***************************
machine_name:
connection_id: 14815
trx_id: 269766
ts: 2024-03-09 20:05:57
user: root
host: localhost
db: test
command: Query
time: 41.000
running_since: 2024-03-09 20:05:16
state: Statistics
info: select * from test where id = 6 for update
trx_state: LOCK WAIT
trx_started: 2024-03-09 20:05:15
trx_requested_lock_id: 269766:821:5:7
trx_tables_in_use: 1
trx_tables_locked: 1
trx_lock_structs: 2
trx_rows_locked: 1
trx_rows_modified: 0
lock_mode: X
lock_type: RECORD
lock_table_schema: test
lock_table_name: test
lock_index: PRIMARY
lock_space: 821
lock_page: 5
lock_rec: 7
lock_data: 6
*************************** 2. row ***************************
machine_name:
connection_id: 14817
trx_id: 269760
ts: 2024-03-09 20:05:57
user: root
host: localhost
db: test
command: Sleep
time: 60.000
running_since: 2024-03-09 20:04:57
state:
info:
trx_state: RUNNING
trx_started: 2024-03-09 20:04:56
trx_requested_lock_id: NULL
trx_tables_in_use: 0
trx_tables_locked: 1
trx_lock_structs: 2
trx_rows_locked: 1
trx_rows_modified: 1
lock_mode: X
lock_type: RECORD
lock_table_schema: test
lock_table_name: test
lock_index: PRIMARY
lock_space: 821
lock_page: 5
lock_rec: 7
lock_data: 6
metadata_lock
SELECT lock_mode, ts, user, host, lock_type, table_schema, table_name, time, started, state, query
FROM metadata_lock
WHERE connection_id = 14347
ORDER BY started DESC
LIMIT 5
;
+-------------------------+---------------------+------+-----------+----------------------+--------------+------------+-------+---------------------+----------------+------------------------------------------------------+
| lock_mode | ts | user | host | lock_type | table_schema | table_name | time | started | state | query |
+-------------------------+---------------------+------+-----------+----------------------+--------------+------------+-------+---------------------+----------------+------------------------------------------------------+
| MDL_SHARED_WRITE | 2024-03-13 10:27:33 | root | localhost | Table metadata lock | test | test | 1.000 | 2024-03-13 10:27:32 | Updating | UPDATE test set data3 = MD5(id) |
| MDL_BACKUP_TRANS_DML | 2024-03-13 10:27:33 | root | localhost | Backup lock | | | 1.000 | 2024-03-13 10:27:32 | Updating | UPDATE test set data3 = MD5(id) |
| MDL_BACKUP_ALTER_COPY | 2024-03-13 10:22:33 | root | localhost | Backup lock | | | 0.000 | 2024-03-13 10:22:33 | altering table | ALTER TABLE test DROP INDEX ts, ADD INDEX (ts, data) |
| MDL_SHARED_UPGRADABLE | 2024-03-13 10:22:33 | root | localhost | Table metadata lock | test | test | 0.000 | 2024-03-13 10:22:33 | altering table | ALTER TABLE test DROP INDEX ts, ADD INDEX (ts, data) |
| MDL_INTENTION_EXCLUSIVE | 2024-03-13 10:22:33 | root | localhost | Schema metadata lock | test | | 0.000 | 2024-03-13 10:22:33 | altering table | ALTER TABLE test DROP INDEX ts, ADD INDEX (ts, data) |
+-------------------------+---------------------+------+-----------+----------------------+--------------+------------+-------+---------------------+----------------+------------------------------------------------------+
global_variables
SELECT variable_name, COUNT(*) AS cnt
FROM global_variables
GROUP BY variable_name
HAVING COUNT(*) > 1
;
+-------------------------+-----+
| variable_name | cnt |
+-------------------------+-----+
| innodb_buffer_pool_size | 7 |
+-------------------------+-----+
SELECT variable_name, ts, variable_value
FROM global_variables
WHERE variable_name = \'innodb_buffer_pool_size\'
;
+-------------------------+---------------------+----------------+
| variable_name | ts | variable_value |
+-------------------------+---------------------+----------------+
| innodb_buffer_pool_size | 2024-03-09 21:36:28 | 134217728 |
| innodb_buffer_pool_size | 2024-03-09 21:40:25 | 268435456 |
| innodb_buffer_pool_size | 2024-03-09 21:48:14 | 134217728 |
+-------------------------+---------------------+----------------+
global_status
SELECT s1.ts
, s1.variable_value AS \'table_open_cache_misses\'
, s2.variable_value AS \'table_open_cache_hits\'
FROM global_status AS s1
JOIN global_status AS s2 ON s1.ts = s2.ts
WHERE s1.variable_name = \'table_open_cache_misses\'
AND s2.variable_name = \'table_open_cache_hits\'
AND s1.ts BETWEEN \'2024-03-13 11:55:00\' AND \'2024-03-13 12:05:00\'
ORDER BY ts ASC
;
+---------------------+-------------------------+-----------------------+
| ts | table_open_cache_misses | table_open_cache_hits |
+---------------------+-------------------------+-----------------------+
| 2024-03-13 11:55:47 | 1001 | 60711 |
| 2024-03-13 11:56:47 | 1008 | 61418 |
| 2024-03-13 11:57:47 | 1015 | 62125 |
| 2024-03-13 11:58:47 | 1022 | 62829 |
| 2024-03-13 11:59:47 | 1029 | 63533 |
| 2024-03-13 12:00:47 | 1036 | 64237 |
| 2024-03-13 12:01:47 | 1043 | 64944 |
| 2024-03-13 12:02:47 | 1050 | 65651 |
| 2024-03-13 12:03:47 | 1057 | 66355 |
| 2024-03-13 12:04:47 | 1064 | 67059 |
+---------------------+-------------------------+-----------------------+
Testing
We have currently rolled out dbstat on our test and production systems to test it and see whether our assumptions regarding stability and calculations of the quantity structure are correct. In addition, using it ourselves is the best way to find out if something is missing or if the handling is impractical (Eat your own dog food).
Sources
sar
Using Oracle Statspack
dbstat on Github
SQL/PSM
Taxonomy upgrade extras: performancemonitoringperformance monitoringmetadata locklocklockingperformance_schema
The post dbstat for MariaDB (and MySQL) appeared first on MariaDB.org.
]]>An idea that I have been thinking about for a long time and have now, thanks to a customer, finally tackled is dbstat for MariaDB/MySQL. The idea is based on sar/sysstat by Sebastien Godard:
sar – Collect, report, or save system activity information.
and Oracle Statspack:
Statspack is a performance tuning tool … to quickly gather detailed analysis of the performance of that database instance.
dbstatAlthough we have had the performance schema for some time, it does not cover some points that we see as a problem in practice and that are requested by customers:
table_size module collects data on the growth of tables. This allows statements to be made about the growth of individual tables, databases, future MariaDB Catalogs or the entire instance. This is interesting for users who are using multi-tenant systems or are otherwise struggling with uncontrolled growth.processlist module takes a snapshot of the process list at regular intervals and saves it. This information is useful for post-mortem analyses if the user was too slow to save his process list or to understand how a problem has built up.trx_and_lck and metadata_lock modules. This means that we can see problems that we did not even notice before or we can see what led to the problem after the accident (analogous to a tachograph in a vehicle).global_variables module. Unfortunately, it is not possible to find out who changed the variable or why. Operational processes are required for this.global_status, actually covers what sar/sysstat does. It collects the values from SHOW GLOBAL STATUS; and saves them for later analysis purposes or to simply create graphs.dbstat workdbstat uses the database Event Scheduler as a scheduler. This must first be switched on for MariaDB (event_scheduler = ON). With MySQL it is already switched on by default. The Event Scheduler has the advantage that we can activate the jobs at a finer granularity, for example 10 s, which would not be possible with the crontab.
The Event Scheduler then executes SQL/PSM code to collect the data on the one hand and to delete the data on the other, so that the dbstat database does not grow immeasurably.
The following jobs are currently planned:
| Module | Collect | Delete | Quantity structure | Remarks |
|---|---|---|---|---|
| table_size | 1/d at 02:04 | 12/h, 1000 rows, > 31 d | 1000 tab × 31 d = 31k rows | Should work up to 288k tables. |
| processlist | 1/min | 1/min, 1000 rows, > 7 d | 1000 con × 1440 min × 7 d = 10M rows | Should work up to 1000 concurrent connections. |
| trx_and_lck | 1/min | 1/min, 1000 rows, > 7 d | 100 lck × 1440 min × 7 d = 1M rows | Depends very much on the application. |
| metadata_lock | 1/min | 12/h, 1000 rows, > 30 d | 100 mdl × 1440 × 30 d = 4M rows | Depends very much on the application. |
| global_variables | 1/min | never | 1000 rows | Normally this table should not grow. |
| global_status | 1/min | 1/min, 1000 rows, > 30 d | 1000 rows × 1440 × 30 d = 40M | Rows Can become large? |
dbstatdbstat can be downloaded from Github and is licensed under GPLv2.
The installation is simple: First execute the SQL file create_user_and_db.sql. Then execute the corresponding create_*.sql files for the respective modules in the dbstat database. There are currently no direct dependencies between the modules. If you want to use a different user or a different database than dbstat, you have to take care of this yourself.
dbstatSome possible queries on the data have already been prepared. They can be found in the query_*.sql files. Here are a few examples:
SELECT `table_schema`, `table_name`, `ts`, `table_rows`, `data_length`, `index_length`
  FROM `table_size`
 WHERE `table_catalog` = 'def'
   AND `table_schema` = 'dbstat'
   AND `table_name` = 'table_size'
ORDER BY `ts` ASC
;
+--------------+------------+---------------------+------------+-------------+--------------+
| table_schema | table_name | ts                  | table_rows | data_length | index_length |
+--------------+------------+---------------------+------------+-------------+--------------+
| dbstat       | table_size | 2024-03-09 20:01:00 |          0 |       16384 |        16384 |
| dbstat       | table_size | 2024-03-10 17:26:33 |        310 |       65536 |        16384 |
| dbstat       | table_size | 2024-03-11 08:28:12 |        622 |      114688 |        49152 |
| dbstat       | table_size | 2024-03-12 08:02:38 |        934 |      114688 |        49152 |
| dbstat       | table_size | 2024-03-13 08:08:55 |       1247 |      278528 |        81920 |
+--------------+------------+---------------------+------------+-------------+--------------+
SELECT connection_id, ts, time, state, SUBSTR(REGEXP_REPLACE(REPLACE(query, "n", ' '), ' +', ' '), 1, 64) AS query
  FROM processlist
 WHERE command != 'Sleep'
   AND connection_id = @connection_id
 ORDER BY ts ASC
 LIMIT 5
;
+---------------+---------------------+---------+---------------------------------+---------------------------------------------+
| connection_id | ts                  | time    | state                           | query                                       |
+---------------+---------------------+---------+---------------------------------+---------------------------------------------+
|         14956 | 2024-03-09 20:21:12 |  13.042 | Waiting for table metadata lock | update test set data = 'bla' where id = 100 |
|         14956 | 2024-03-09 20:22:12 |  73.045 | Waiting for table metadata lock | update test set data = 'bla' where id = 100 |
|         14956 | 2024-03-09 20:23:12 | 133.044 | Waiting for table metadata lock | update test set data = 'bla' where id = 100 |
|         14956 | 2024-03-09 20:24:12 | 193.044 | Waiting for table metadata lock | update test set data = 'bla' where id = 100 |
|         14956 | 2024-03-09 20:25:12 | 253.041 | Waiting for table metadata lock | update test set data = 'bla' where id = 100 |
+---------------+---------------------+---------+---------------------------------+---------------------------------------------+
SELECT * FROM trx_and_lckG
*************************** 1. row ***************************
         machine_name:
        connection_id: 14815
               trx_id: 269766
                   ts: 2024-03-09 20:05:57
                 user: root
                 host: localhost
                   db: test
              command: Query
                 time: 41.000
        running_since: 2024-03-09 20:05:16
                state: Statistics
                 info: select * from test where id = 6 for update
            trx_state: LOCK WAIT
          trx_started: 2024-03-09 20:05:15
trx_requested_lock_id: 269766:821:5:7
    trx_tables_in_use: 1
    trx_tables_locked: 1
     trx_lock_structs: 2
      trx_rows_locked: 1
    trx_rows_modified: 0
            lock_mode: X
            lock_type: RECORD
    lock_table_schema: test
      lock_table_name: test
           lock_index: PRIMARY
           lock_space: 821
            lock_page: 5
             lock_rec: 7
            lock_data: 6
*************************** 2. row ***************************
         machine_name:
        connection_id: 14817
               trx_id: 269760
                   ts: 2024-03-09 20:05:57
                 user: root
                 host: localhost
                   db: test
              command: Sleep
                 time: 60.000
        running_since: 2024-03-09 20:04:57
                state:
                 info:
            trx_state: RUNNING
          trx_started: 2024-03-09 20:04:56
trx_requested_lock_id: NULL
    trx_tables_in_use: 0
    trx_tables_locked: 1
     trx_lock_structs: 2
      trx_rows_locked: 1
    trx_rows_modified: 1
            lock_mode: X
            lock_type: RECORD
    lock_table_schema: test
      lock_table_name: test
           lock_index: PRIMARY
           lock_space: 821
            lock_page: 5
             lock_rec: 7
            lock_data: 6
SELECT lock_mode, ts, user, host, lock_type, table_schema, table_name, time, started, state, query
  FROM metadata_lock
 WHERE connection_id = 14347
 ORDER BY started DESC
 LIMIT 5
;
+-------------------------+---------------------+------+-----------+----------------------+--------------+------------+-------+---------------------+----------------+------------------------------------------------------+
| lock_mode               | ts                  | user | host      | lock_type            | table_schema | table_name | time  | started             | state          | query                                                |
+-------------------------+---------------------+------+-----------+----------------------+--------------+------------+-------+---------------------+----------------+------------------------------------------------------+
| MDL_SHARED_WRITE        | 2024-03-13 10:27:33 | root | localhost | Table metadata lock  | test         | test       | 1.000 | 2024-03-13 10:27:32 | Updating       | UPDATE test set data3 = MD5(id)                      |
| MDL_BACKUP_TRANS_DML    | 2024-03-13 10:27:33 | root | localhost | Backup lock          |              |            | 1.000 | 2024-03-13 10:27:32 | Updating       | UPDATE test set data3 = MD5(id)                      |
| MDL_BACKUP_ALTER_COPY   | 2024-03-13 10:22:33 | root | localhost | Backup lock          |              |            | 0.000 | 2024-03-13 10:22:33 | altering table | ALTER TABLE test DROP INDEX ts, ADD INDEX (ts, data) |
| MDL_SHARED_UPGRADABLE   | 2024-03-13 10:22:33 | root | localhost | Table metadata lock  | test         | test       | 0.000 | 2024-03-13 10:22:33 | altering table | ALTER TABLE test DROP INDEX ts, ADD INDEX (ts, data) |
| MDL_INTENTION_EXCLUSIVE | 2024-03-13 10:22:33 | root | localhost | Schema metadata lock | test         |            | 0.000 | 2024-03-13 10:22:33 | altering table | ALTER TABLE test DROP INDEX ts, ADD INDEX (ts, data) |
+-------------------------+---------------------+------+-----------+----------------------+--------------+------------+-------+---------------------+----------------+------------------------------------------------------+
SELECT variable_name, COUNT(*) AS cnt
  FROM global_variables
 GROUP BY variable_name
 HAVING COUNT(*) > 1
;
+-------------------------+-----+
| variable_name           | cnt |
+-------------------------+-----+
| innodb_buffer_pool_size |   7 |
+-------------------------+-----+

SELECT variable_name, ts, variable_value
  FROM global_variables
 WHERE variable_name = 'innodb_buffer_pool_size'
;
+-------------------------+---------------------+----------------+
| variable_name           | ts                  | variable_value |
+-------------------------+---------------------+----------------+
| innodb_buffer_pool_size | 2024-03-09 21:36:28 | 134217728      |
| innodb_buffer_pool_size | 2024-03-09 21:40:25 | 268435456      |
| innodb_buffer_pool_size | 2024-03-09 21:48:14 | 134217728      |
+-------------------------+---------------------+----------------+
SELECT s1.ts
     , s1.variable_value AS 'table_open_cache_misses'
     , s2.variable_value AS 'table_open_cache_hits'
  FROM global_status AS s1
  JOIN global_status AS s2 ON s1.ts = s2.ts
 WHERE s1.variable_name = 'table_open_cache_misses'
   AND s2.variable_name = 'table_open_cache_hits'
   AND s1.ts BETWEEN '2024-03-13 11:55:00' AND '2024-03-13 12:05:00'
 ORDER BY ts ASC
;
+---------------------+-------------------------+-----------------------+
| ts                  | table_open_cache_misses | table_open_cache_hits |
+---------------------+-------------------------+-----------------------+
| 2024-03-13 11:55:47 | 1001                    | 60711                 |
| 2024-03-13 11:56:47 | 1008                    | 61418                 |
| 2024-03-13 11:57:47 | 1015                    | 62125                 |
| 2024-03-13 11:58:47 | 1022                    | 62829                 |
| 2024-03-13 11:59:47 | 1029                    | 63533                 |
| 2024-03-13 12:00:47 | 1036                    | 64237                 |
| 2024-03-13 12:01:47 | 1043                    | 64944                 |
| 2024-03-13 12:02:47 | 1050                    | 65651                 |
| 2024-03-13 12:03:47 | 1057                    | 66355                 |
| 2024-03-13 12:04:47 | 1064                    | 67059                 |
+---------------------+-------------------------+-----------------------+
We have currently rolled out dbstat on our test and production systems to test it and see whether our assumptions regarding stability and calculations of the quantity structure are correct. In addition, using it ourselves is the best way to find out if something is missing or if the handling is impractical (Eat your own dog food).
The post dbstat for MariaDB (and MySQL) appeared first on MariaDB.org.
]]> Functionality of dbstat
How does dbstat work
How to install dbstat
Query dbstat
table_size
processlist
trx_and_lck
metadata_lock
global_variables
global_status
Testing
Sources
An idea that I have been thinking about for a long time and have now, thanks to a customer, finally tackled is dbstat for MariaDB/MySQL. The idea is based on sar/sysstat by Sebastien Godard:
sar - Collect, report, or save system activity information.
and Oracle Statspack:
Statspack is a performance tuning tool ... to quickly gather detailed analysis of the performance of that database instance.
Functionality of dbstat
Although we have had the performance schema for some time, it does not cover some points that we see as a problem in practice and that are requested by customers:
The table_size module collects data on the growth of tables. This allows statements to be made about the growth of individual tables, databases, future MariaDB Catalogs or the entire instance. This is interesting for users who are using multi-tenant systems or are otherwise struggling with uncontrolled growth.
The processlist module takes a snapshot of the process list at regular intervals and saves it. This information is useful for post-mortem analyses if the user was too slow to save his process list or to understand how a problem has built up.
The problem is often caused by long-running transactions, row locks or metadata locks. These are recorded and saved by the trx_and_lck and metadata_lock modules. This means that we can see problems that we did not even notice before or we can see what led to the problem after the accident (analogous to a tachograph in a vehicle).
Another question that we sometimes encounter in practice is: When was which database variable changed and what did it look like before? This is covered by the global_variables module. Unfortunately, it is not possible to find out who changed the variable or why. Operational processes are required for this.
The last module, global_status, actually covers what sar/sysstat does. It collects the values from SHOW GLOBAL STATUS; and saves them for later analysis purposes or to simply create graphs.
How does dbstat work
dbstat uses the database Event Scheduler as a scheduler. This must first be switched on for MariaDB (event_scheduler = ON). With MySQL it is already switched on by default. The Event Scheduler has the advantage that we can activate the jobs at a finer granularity, for example 10 s, which would not be possible with the crontab.
The Event Scheduler then executes SQL/PSM code to collect the data on the one hand and to delete the data on the other, so that the dbstat database does not grow immeasurably.
The following jobs are currently planned:
ModuleCollectDeleteQuantity structureRemarks
table_size1/d at 02:0412/h, 1000 rows, > 31 d1000 tab × 31 d = 31k rowsShould work up to 288k tables.
processlist1/min1/min, 1000 rows, > 7 d1000 con × 1440 min × 7 d = 10M rowsShould work up to 1000 concurrent connections.
trx_and_lck1/min1/min, 1000 rows, > 7 d100 lck × 1440 min × 7 d = 1M rowsDepends very much on the application.
metadata_lock1/min12/h, 1000 rows, > 30 d100 mdl × 1440 × 30 d = 4M rowsDepends very much on the application.
global_variables1/minnever1000 rowsNormally this table should not grow.
global_status1/min1/min, 1000 rows, > 30 d1000 rows × 1440 × 30 d = 40MRows Can become large?
How to install dbstat
dbstat can be downloaded from Github and is licensed under GPLv2.
The installation is simple: First execute the SQL file create_user_and_db.sql. Then execute the corresponding create_*.sql files for the respective modules in the dbstat database. There are currently no direct dependencies between the modules. If you want to use a different user or a different database than dbstat, you have to take care of this yourself.
Query dbstat
Some possible queries on the data have already been prepared. They can be found in the query_*.sql files. Here are a few examples:
table_size
SELECT `table_schema`, `table_name`, `ts`, `table_rows`, `data_length`, `index_length`
FROM `table_size`
WHERE `table_catalog` = \'def\'
AND `table_schema` = \'dbstat\'
AND `table_name` = \'table_size\'
ORDER BY `ts` ASC
;
+--------------+------------+---------------------+------------+-------------+--------------+
| table_schema | table_name | ts | table_rows | data_length | index_length |
+--------------+------------+---------------------+------------+-------------+--------------+
| dbstat | table_size | 2024-03-09 20:01:00 | 0 | 16384 | 16384 |
| dbstat | table_size | 2024-03-10 17:26:33 | 310 | 65536 | 16384 |
| dbstat | table_size | 2024-03-11 08:28:12 | 622 | 114688 | 49152 |
| dbstat | table_size | 2024-03-12 08:02:38 | 934 | 114688 | 49152 |
| dbstat | table_size | 2024-03-13 08:08:55 | 1247 | 278528 | 81920 |
+--------------+------------+---------------------+------------+-------------+--------------+
processlist
SELECT connection_id, ts, time, state, SUBSTR(REGEXP_REPLACE(REPLACE(query, \"n\", \' \'), \' +\', \' \'), 1, 64) AS query
FROM processlist
WHERE command != \'Sleep\'
AND connection_id = @connection_id
ORDER BY ts ASC
LIMIT 5
;
+---------------+---------------------+---------+---------------------------------+---------------------------------------------+
| connection_id | ts | time | state | query |
+---------------+---------------------+---------+---------------------------------+---------------------------------------------+
| 14956 | 2024-03-09 20:21:12 | 13.042 | Waiting for table metadata lock | update test set data = \'bla\' where id = 100 |
| 14956 | 2024-03-09 20:22:12 | 73.045 | Waiting for table metadata lock | update test set data = \'bla\' where id = 100 |
| 14956 | 2024-03-09 20:23:12 | 133.044 | Waiting for table metadata lock | update test set data = \'bla\' where id = 100 |
| 14956 | 2024-03-09 20:24:12 | 193.044 | Waiting for table metadata lock | update test set data = \'bla\' where id = 100 |
| 14956 | 2024-03-09 20:25:12 | 253.041 | Waiting for table metadata lock | update test set data = \'bla\' where id = 100 |
+---------------+---------------------+---------+---------------------------------+---------------------------------------------+
trx_and_lck
SELECT * FROM trx_and_lckG
*************************** 1. row ***************************
machine_name:
connection_id: 14815
trx_id: 269766
ts: 2024-03-09 20:05:57
user: root
host: localhost
db: test
command: Query
time: 41.000
running_since: 2024-03-09 20:05:16
state: Statistics
info: select * from test where id = 6 for update
trx_state: LOCK WAIT
trx_started: 2024-03-09 20:05:15
trx_requested_lock_id: 269766:821:5:7
trx_tables_in_use: 1
trx_tables_locked: 1
trx_lock_structs: 2
trx_rows_locked: 1
trx_rows_modified: 0
lock_mode: X
lock_type: RECORD
lock_table_schema: test
lock_table_name: test
lock_index: PRIMARY
lock_space: 821
lock_page: 5
lock_rec: 7
lock_data: 6
*************************** 2. row ***************************
machine_name:
connection_id: 14817
trx_id: 269760
ts: 2024-03-09 20:05:57
user: root
host: localhost
db: test
command: Sleep
time: 60.000
running_since: 2024-03-09 20:04:57
state:
info:
trx_state: RUNNING
trx_started: 2024-03-09 20:04:56
trx_requested_lock_id: NULL
trx_tables_in_use: 0
trx_tables_locked: 1
trx_lock_structs: 2
trx_rows_locked: 1
trx_rows_modified: 1
lock_mode: X
lock_type: RECORD
lock_table_schema: test
lock_table_name: test
lock_index: PRIMARY
lock_space: 821
lock_page: 5
lock_rec: 7
lock_data: 6
metadata_lock
SELECT lock_mode, ts, user, host, lock_type, table_schema, table_name, time, started, state, query
FROM metadata_lock
WHERE connection_id = 14347
ORDER BY started DESC
LIMIT 5
;
+-------------------------+---------------------+------+-----------+----------------------+--------------+------------+-------+---------------------+----------------+------------------------------------------------------+
| lock_mode | ts | user | host | lock_type | table_schema | table_name | time | started | state | query |
+-------------------------+---------------------+------+-----------+----------------------+--------------+------------+-------+---------------------+----------------+------------------------------------------------------+
| MDL_SHARED_WRITE | 2024-03-13 10:27:33 | root | localhost | Table metadata lock | test | test | 1.000 | 2024-03-13 10:27:32 | Updating | UPDATE test set data3 = MD5(id) |
| MDL_BACKUP_TRANS_DML | 2024-03-13 10:27:33 | root | localhost | Backup lock | | | 1.000 | 2024-03-13 10:27:32 | Updating | UPDATE test set data3 = MD5(id) |
| MDL_BACKUP_ALTER_COPY | 2024-03-13 10:22:33 | root | localhost | Backup lock | | | 0.000 | 2024-03-13 10:22:33 | altering table | ALTER TABLE test DROP INDEX ts, ADD INDEX (ts, data) |
| MDL_SHARED_UPGRADABLE | 2024-03-13 10:22:33 | root | localhost | Table metadata lock | test | test | 0.000 | 2024-03-13 10:22:33 | altering table | ALTER TABLE test DROP INDEX ts, ADD INDEX (ts, data) |
| MDL_INTENTION_EXCLUSIVE | 2024-03-13 10:22:33 | root | localhost | Schema metadata lock | test | | 0.000 | 2024-03-13 10:22:33 | altering table | ALTER TABLE test DROP INDEX ts, ADD INDEX (ts, data) |
+-------------------------+---------------------+------+-----------+----------------------+--------------+------------+-------+---------------------+----------------+------------------------------------------------------+
global_variables
SELECT variable_name, COUNT(*) AS cnt
FROM global_variables
GROUP BY variable_name
HAVING COUNT(*) > 1
;
+-------------------------+-----+
| variable_name | cnt |
+-------------------------+-----+
| innodb_buffer_pool_size | 7 |
+-------------------------+-----+
SELECT variable_name, ts, variable_value
FROM global_variables
WHERE variable_name = \'innodb_buffer_pool_size\'
;
+-------------------------+---------------------+----------------+
| variable_name | ts | variable_value |
+-------------------------+---------------------+----------------+
| innodb_buffer_pool_size | 2024-03-09 21:36:28 | 134217728 |
| innodb_buffer_pool_size | 2024-03-09 21:40:25 | 268435456 |
| innodb_buffer_pool_size | 2024-03-09 21:48:14 | 134217728 |
+-------------------------+---------------------+----------------+
global_status
SELECT s1.ts
, s1.variable_value AS \'table_open_cache_misses\'
, s2.variable_value AS \'table_open_cache_hits\'
FROM global_status AS s1
JOIN global_status AS s2 ON s1.ts = s2.ts
WHERE s1.variable_name = \'table_open_cache_misses\'
AND s2.variable_name = \'table_open_cache_hits\'
AND s1.ts BETWEEN \'2024-03-13 11:55:00\' AND \'2024-03-13 12:05:00\'
ORDER BY ts ASC
;
+---------------------+-------------------------+-----------------------+
| ts | table_open_cache_misses | table_open_cache_hits |
+---------------------+-------------------------+-----------------------+
| 2024-03-13 11:55:47 | 1001 | 60711 |
| 2024-03-13 11:56:47 | 1008 | 61418 |
| 2024-03-13 11:57:47 | 1015 | 62125 |
| 2024-03-13 11:58:47 | 1022 | 62829 |
| 2024-03-13 11:59:47 | 1029 | 63533 |
| 2024-03-13 12:00:47 | 1036 | 64237 |
| 2024-03-13 12:01:47 | 1043 | 64944 |
| 2024-03-13 12:02:47 | 1050 | 65651 |
| 2024-03-13 12:03:47 | 1057 | 66355 |
| 2024-03-13 12:04:47 | 1064 | 67059 |
+---------------------+-------------------------+-----------------------+
Testing
We have currently rolled out dbstat on our test and production systems to test it and see whether our assumptions regarding stability and calculations of the quantity structure are correct. In addition, using it ourselves is the best way to find out if something is missing or if the handling is impractical (Eat your own dog food).
Sources
sar
Using Oracle Statspack
dbstat on Github
SQL/PSM
Taxonomy upgrade extras: performancemonitoringperformance monitoringmetadata locklocklockingperformance_schema
The post Shinguz: dbstat for MariaDB (and MySQL) appeared first on MariaDB.org.
]]>An idea that I have been thinking about for a long time and have now, thanks to a customer, finally tackled is dbstat for MariaDB/MySQL. The idea is based on sar/sysstat by Sebastien Godard:
sar – Collect, report, or save system activity information.
and Oracle Statspack:
Statspack is a performance tuning tool … to quickly gather detailed analysis of the performance of that database instance.
dbstatAlthough we have had the performance schema for some time, it does not cover some points that we see as a problem in practice and that are requested by customers:
table_size module collects data on the growth of tables. This allows statements to be made about the growth of individual tables, databases, future MariaDB Catalogs or the entire instance. This is interesting for users who are using multi-tenant systems or are otherwise struggling with uncontrolled growth.processlist module takes a snapshot of the process list at regular intervals and saves it. This information is useful for post-mortem analyses if the user was too slow to save his process list or to understand how a problem has built up.trx_and_lck and metadata_lock modules. This means that we can see problems that we did not even notice before or we can see what led to the problem after the accident (analogous to a tachograph in a vehicle).global_variables module. Unfortunately, it is not possible to find out who changed the variable or why. Operational processes are required for this.global_status, actually covers what sar/sysstat does. It collects the values from SHOW GLOBAL STATUS; and saves them for later analysis purposes or to simply create graphs.dbstat workdbstat uses the database Event Scheduler as a scheduler. This must first be switched on for MariaDB (event_scheduler = ON). With MySQL it is already switched on by default. The Event Scheduler has the advantage that we can activate the jobs at a finer granularity, for example 10 s, which would not be possible with the crontab.
The Event Scheduler then executes SQL/PSM code to collect the data on the one hand and to delete the data on the other, so that the dbstat database does not grow immeasurably.
The following jobs are currently planned:
| Module | Collect | Delete | Quantity structure | Remarks |
|---|---|---|---|---|
| table_size | 1/d at 02:04 | 12/h, 1000 rows, > 31 d | 1000 tab × 31 d = 31k rows | Should work up to 288k tables. |
| processlist | 1/min | 1/min, 1000 rows, > 7 d | 1000 con × 1440 min × 7 d = 10M rows | Should work up to 1000 concurrent connections. |
| trx_and_lck | 1/min | 1/min, 1000 rows, > 7 d | 100 lck × 1440 min × 7 d = 1M rows | Depends very much on the application. |
| metadata_lock | 1/min | 12/h, 1000 rows, > 30 d | 100 mdl × 1440 × 30 d = 4M rows | Depends very much on the application. |
| global_variables | 1/min | never | 1000 rows | Normally this table should not grow. |
| global_status | 1/min | 1/min, 1000 rows, > 30 d | 1000 rows × 1440 × 30 d = 40M | Rows Can become large? |
dbstatdbstat can be downloaded from Github and is licensed under GPLv2.
The installation is simple: First execute the SQL file create_user_and_db.sql. Then execute the corresponding create_*.sql files for the respective modules in the dbstat database. There are currently no direct dependencies between the modules. If you want to use a different user or a different database than dbstat, you have to take care of this yourself.
dbstatSome possible queries on the data have already been prepared. They can be found in the query_*.sql files. Here are a few examples:
SELECT `table_schema`, `table_name`, `ts`, `table_rows`, `data_length`, `index_length`
  FROM `table_size`
 WHERE `table_catalog` = 'def'
   AND `table_schema` = 'dbstat'
   AND `table_name` = 'table_size'
ORDER BY `ts` ASC
;
+--------------+------------+---------------------+------------+-------------+--------------+
| table_schema | table_name | ts                  | table_rows | data_length | index_length |
+--------------+------------+---------------------+------------+-------------+--------------+
| dbstat       | table_size | 2024-03-09 20:01:00 |          0 |       16384 |        16384 |
| dbstat       | table_size | 2024-03-10 17:26:33 |        310 |       65536 |        16384 |
| dbstat       | table_size | 2024-03-11 08:28:12 |        622 |      114688 |        49152 |
| dbstat       | table_size | 2024-03-12 08:02:38 |        934 |      114688 |        49152 |
| dbstat       | table_size | 2024-03-13 08:08:55 |       1247 |      278528 |        81920 |
+--------------+------------+---------------------+------------+-------------+--------------+
SELECT connection_id, ts, time, state, SUBSTR(REGEXP_REPLACE(REPLACE(query, "n", ' '), ' +', ' '), 1, 64) AS query
  FROM processlist
 WHERE command != 'Sleep'
   AND connection_id = @connection_id
 ORDER BY ts ASC
 LIMIT 5
;
+---------------+---------------------+---------+---------------------------------+---------------------------------------------+
| connection_id | ts                  | time    | state                           | query                                       |
+---------------+---------------------+---------+---------------------------------+---------------------------------------------+
|         14956 | 2024-03-09 20:21:12 |  13.042 | Waiting for table metadata lock | update test set data = 'bla' where id = 100 |
|         14956 | 2024-03-09 20:22:12 |  73.045 | Waiting for table metadata lock | update test set data = 'bla' where id = 100 |
|         14956 | 2024-03-09 20:23:12 | 133.044 | Waiting for table metadata lock | update test set data = 'bla' where id = 100 |
|         14956 | 2024-03-09 20:24:12 | 193.044 | Waiting for table metadata lock | update test set data = 'bla' where id = 100 |
|         14956 | 2024-03-09 20:25:12 | 253.041 | Waiting for table metadata lock | update test set data = 'bla' where id = 100 |
+---------------+---------------------+---------+---------------------------------+---------------------------------------------+
SELECT * FROM trx_and_lckG
*************************** 1. row ***************************
         machine_name:
        connection_id: 14815
               trx_id: 269766
                   ts: 2024-03-09 20:05:57
                 user: root
                 host: localhost
                   db: test
              command: Query
                 time: 41.000
        running_since: 2024-03-09 20:05:16
                state: Statistics
                 info: select * from test where id = 6 for update
            trx_state: LOCK WAIT
          trx_started: 2024-03-09 20:05:15
trx_requested_lock_id: 269766:821:5:7
    trx_tables_in_use: 1
    trx_tables_locked: 1
     trx_lock_structs: 2
      trx_rows_locked: 1
    trx_rows_modified: 0
            lock_mode: X
            lock_type: RECORD
    lock_table_schema: test
      lock_table_name: test
           lock_index: PRIMARY
           lock_space: 821
            lock_page: 5
             lock_rec: 7
            lock_data: 6
*************************** 2. row ***************************
         machine_name:
        connection_id: 14817
               trx_id: 269760
                   ts: 2024-03-09 20:05:57
                 user: root
                 host: localhost
                   db: test
              command: Sleep
                 time: 60.000
        running_since: 2024-03-09 20:04:57
                state:
                 info:
            trx_state: RUNNING
          trx_started: 2024-03-09 20:04:56
trx_requested_lock_id: NULL
    trx_tables_in_use: 0
    trx_tables_locked: 1
     trx_lock_structs: 2
      trx_rows_locked: 1
    trx_rows_modified: 1
            lock_mode: X
            lock_type: RECORD
    lock_table_schema: test
      lock_table_name: test
           lock_index: PRIMARY
           lock_space: 821
            lock_page: 5
             lock_rec: 7
            lock_data: 6
SELECT lock_mode, ts, user, host, lock_type, table_schema, table_name, time, started, state, query
  FROM metadata_lock
 WHERE connection_id = 14347
 ORDER BY started DESC
 LIMIT 5
;
+-------------------------+---------------------+------+-----------+----------------------+--------------+------------+-------+---------------------+----------------+------------------------------------------------------+
| lock_mode               | ts                  | user | host      | lock_type            | table_schema | table_name | time  | started             | state          | query                                                |
+-------------------------+---------------------+------+-----------+----------------------+--------------+------------+-------+---------------------+----------------+------------------------------------------------------+
| MDL_SHARED_WRITE        | 2024-03-13 10:27:33 | root | localhost | Table metadata lock  | test         | test       | 1.000 | 2024-03-13 10:27:32 | Updating       | UPDATE test set data3 = MD5(id)                      |
| MDL_BACKUP_TRANS_DML    | 2024-03-13 10:27:33 | root | localhost | Backup lock          |              |            | 1.000 | 2024-03-13 10:27:32 | Updating       | UPDATE test set data3 = MD5(id)                      |
| MDL_BACKUP_ALTER_COPY   | 2024-03-13 10:22:33 | root | localhost | Backup lock          |              |            | 0.000 | 2024-03-13 10:22:33 | altering table | ALTER TABLE test DROP INDEX ts, ADD INDEX (ts, data) |
| MDL_SHARED_UPGRADABLE   | 2024-03-13 10:22:33 | root | localhost | Table metadata lock  | test         | test       | 0.000 | 2024-03-13 10:22:33 | altering table | ALTER TABLE test DROP INDEX ts, ADD INDEX (ts, data) |
| MDL_INTENTION_EXCLUSIVE | 2024-03-13 10:22:33 | root | localhost | Schema metadata lock | test         |            | 0.000 | 2024-03-13 10:22:33 | altering table | ALTER TABLE test DROP INDEX ts, ADD INDEX (ts, data) |
+-------------------------+---------------------+------+-----------+----------------------+--------------+------------+-------+---------------------+----------------+------------------------------------------------------+
SELECT variable_name, COUNT(*) AS cnt
  FROM global_variables
 GROUP BY variable_name
 HAVING COUNT(*) > 1
;
+-------------------------+-----+
| variable_name           | cnt |
+-------------------------+-----+
| innodb_buffer_pool_size |   7 |
+-------------------------+-----+

SELECT variable_name, ts, variable_value
  FROM global_variables
 WHERE variable_name = 'innodb_buffer_pool_size'
;
+-------------------------+---------------------+----------------+
| variable_name           | ts                  | variable_value |
+-------------------------+---------------------+----------------+
| innodb_buffer_pool_size | 2024-03-09 21:36:28 | 134217728      |
| innodb_buffer_pool_size | 2024-03-09 21:40:25 | 268435456      |
| innodb_buffer_pool_size | 2024-03-09 21:48:14 | 134217728      |
+-------------------------+---------------------+----------------+
SELECT s1.ts
     , s1.variable_value AS 'table_open_cache_misses'
     , s2.variable_value AS 'table_open_cache_hits'
  FROM global_status AS s1
  JOIN global_status AS s2 ON s1.ts = s2.ts
 WHERE s1.variable_name = 'table_open_cache_misses'
   AND s2.variable_name = 'table_open_cache_hits'
   AND s1.ts BETWEEN '2024-03-13 11:55:00' AND '2024-03-13 12:05:00'
 ORDER BY ts ASC
;
+---------------------+-------------------------+-----------------------+
| ts                  | table_open_cache_misses | table_open_cache_hits |
+---------------------+-------------------------+-----------------------+
| 2024-03-13 11:55:47 | 1001                    | 60711                 |
| 2024-03-13 11:56:47 | 1008                    | 61418                 |
| 2024-03-13 11:57:47 | 1015                    | 62125                 |
| 2024-03-13 11:58:47 | 1022                    | 62829                 |
| 2024-03-13 11:59:47 | 1029                    | 63533                 |
| 2024-03-13 12:00:47 | 1036                    | 64237                 |
| 2024-03-13 12:01:47 | 1043                    | 64944                 |
| 2024-03-13 12:02:47 | 1050                    | 65651                 |
| 2024-03-13 12:03:47 | 1057                    | 66355                 |
| 2024-03-13 12:04:47 | 1064                    | 67059                 |
+---------------------+-------------------------+-----------------------+
We have currently rolled out dbstat on our test and production systems to test it and see whether our assumptions regarding stability and calculations of the quantity structure are correct. In addition, using it ourselves is the best way to find out if something is missing or if the handling is impractical (Eat your own dog food).
The post Shinguz: dbstat for MariaDB (and MySQL) appeared first on MariaDB.org.
]]>The post ClusterControl adds in-place major PostgreSQL upgrade and pgvector extension in latest release appeared first on MariaDB.org.
]]>Let’s dive into the details to help you get up and running with these latest enhancements.
An in-place PostgreSQL major upgrade involves upgrading your current PostgreSQL instance to a newer major version directly on the same server. This method uses the pg_upgrade tool to facilitate a smooth transition to the latest version.
If your PostgreSQL database is running on an outdated version, we strongly advise upgrading to a newer version to reap the following benefits:
In summary, performing an in-place PostgreSQL major upgrade will enable you to take advantage of vital built-in functionalities, security updates, performance improvements, and implementations beneficial for database management.
How to upgrade your PostgreSQL version from the ClusterControl GUI:
Upgrading your PostgreSQL version with ClusterControl is easy with our intuitive wizard. Just follow these simple steps:
To help you through the upgrade process, refer to our documentation.
Pgvector, an open-source extension designed for PostgreSQL, functions as a robust tool for managing embeddings within PostgreSQL environments.
A significant addition to the PostgreSQL ecosystem, pgvector excels in identifying both precise and approximate nearest neighbors, thereby facilitating search functionality, recommendations, and anomaly detection.
Let’s delve into the powerful features and compelling use cases of pgvector.
Key features and benefits of pgvector:
Explore pgvector use cases:
How to enable pgvector from the ClusterControl GUI:
For more information, check our documentation and this pgvector resource.
If you’re a MongoDB user looking to perform a minor upgrade, we have you covered! This release also includes support for minor upgrades for replicaset and sharded clusters.
Head to the Upgrades tab in ClusterControl, conduct a quick version check and proceed with the upgrade process.
For more information, see our documentation for all the details.
ClusterControl v1.9.8 offers a range of other enhancements across MongoDB, MySQL, and the user interface:
MongoDB updates:
MySQL updates:
Interface improvements:
We’re committed to adding new ClusterControl capabilities as we strive to empower you to deploy, monitor, and scale your open-source databases in various environments (cloud, on-premise, hybrid).
Stay tuned for the next exciting ClusterControl release (v1.9.9), featuring support for the Redis Cluster, additional upgrades to multiple databases, and the ability to scale CC to thousands of nodes.
For more insights into v1.9.8, visit our changelogs for the details!
New to ClusterControl? Try our Enterprise edition free for 30 days and get technical support to guide you throughout your journey.
The post ClusterControl adds in-place major PostgreSQL upgrade and pgvector extension in latest release appeared first on Severalnines.
The post ClusterControl adds in-place major PostgreSQL upgrade and pgvector extension in latest release appeared first on MariaDB.org.
]]>The post MariaDB Enterprise Server Q1 2024 maintenance releases appeared first on MariaDB.org.
]]>The post MariaDB Enterprise Server Q1 2024 maintenance releases appeared first on MariaDB.org.
]]>The post Self-Hosted ServiceNow Quick Start Guide for MariaDB Enterprise Server 10.6 appeared first on MariaDB.org.
]]>The post Self-Hosted ServiceNow Quick Start Guide for MariaDB Enterprise Server 10.6 appeared first on MariaDB.org.
]]>The post Percona Operator for MySQL Now Supports Automated Volume Expansion in Technical Preview appeared first on MariaDB.org.
]]> Volume Expansion, a feature that became generally available since Kubernetes version 1.24, allows users to increase the capacity of their Persistent Volumes and underlying storage within Kubernetes. There is no need to use clouds’ UI or APIs to do that anymore. In our Operators, we use Stateful Sets – a Kubernetes resource that was designed for […]
The post Percona Operator for MySQL Now Supports Automated Volume Expansion in Technical Preview appeared first on MariaDB.org.
]]>The post Efficient Integration of PostgreSQL 16 with LDAP: Best Practices and Tips appeared first on MariaDB.org.
]]>The pg_hba.conf file is where you configure client authentication in PostgreSQL. To set up LDAP authentication, you will need to add entries to this file specifying ldap as the authentication method for the desired databases and users.
In your pg_hba.conf, add an entry like the following to specify LDAP authentication:
host all all 0.0.0.0/0 ldap ldapserver=ldap.example.com ldapport=389 ldapbinddn="cn=admin,dc=example,dc=com" ldapbindpasswd=secret ldapprefix="uid=" ldapsuffix=",dc=example,dc=com"
Adjust the parameters to fit your LDAP server’s configuration:
ldapserver: The hostname of your LDAP server.ldapport: The port on which your LDAP server is listening (389 is the default, 636 for LDAPS).ldapbinddn and ldapbindpasswd: The distinguished name (DN) and password for binding to the LDAP server. These are required if your LDAP server does not allow anonymous binds.ldapprefix and ldapsuffix: Strings that are prepended and appended to the username to form the user’s DN. This depends on your LDAP schema.To ensure that authentication credentials and information are securely transmitted, configure LDAP over SSL (LDAPS) or start TLS:
ldaps:// in your ldapserver URL and set the port to 636.ldapstarttls=1 to your pg_hba.conf entry.Make sure your PostgreSQL server trusts your LDAP server’s SSL certificate. You might need to add the LDAP server’s CA certificate to the PostgreSQL server’s trust store.
Before applying the configuration widely, test the LDAP connection with a few database users to ensure that authentication works as expected. Use the psql command-line tool or another PostgreSQL client to test logging in with LDAP credentials.
If your LDAP directory structure requires it, you can use a custom search filter with the ldapsearchattribute and ldapsearchfilter options in pg_hba.conf:
ldapsearchattribute=uid ldapsearchfilter="(|(memberOf=cn=dbadmins,ou=groups,dc=example,dc=com)(memberOf=cn=developers,ou=groups,dc=example,dc=com))"
This allows more complex queries, like restricting authentication to members of certain groups.
After making changes to pg_hba.conf, reload the PostgreSQL configuration for the changes to take effect without restarting the database:
pg_ctl reload
Initially, it’s useful to increase logging for connection and authentication issues. Adjust the log_connections, log_disconnections, and log_line_prefix settings in postgresql.conf to help diagnose any problems.
Integrating PostgreSQL with LDAP is a powerful way to manage database authentication centrally. By following these tips and ensuring secure LDAP connections, you can streamline user management while maintaining high security standards. Always refer to the PostgreSQL documentation for the most current information and best practices.
The post Efficient Integration of PostgreSQL 16 with LDAP: Best Practices and Tips appeared first on The WebScale Database Infrastructure Operations Experts in PostgreSQL, MySQL, MariaDB and ClickHouse.
The post Efficient Integration of PostgreSQL 16 with LDAP: Best Practices and Tips appeared first on MariaDB.org.
]]>The post How to define and capture Baselines in PostgreSQL Performance Troubleshooting? appeared first on MariaDB.org.
]]>First, identify which metrics are crucial for understanding the health and performance of your PostgreSQL database. These typically include:
PostgreSQL provides several views that can be queried to collect baseline data:
pg_stat_statements extension to be enabled).Choose a period of normal operation that represents typical usage patterns of your database. This might be a few hours, days, or even weeks, depending on the variability of your workload.
Collect data on the key performance metrics identified earlier. This can be done manually by running queries against the relevant PostgreSQL views at regular intervals, or automatically using monitoring tools.
Aggregate the collected data to produce summary statistics for each metric. Analyze this data to establish average and peak values, identify patterns, and understand the normal range of variability for each metric.
Create a report or dashboard summarizing the baseline data. This should include not just the raw metrics, but also any insights or patterns observed during the baseline period. This documentation will be your reference point for future performance troubleshooting.
Set up continuous monitoring to track the key performance metrics against the established baseline. Many tools and extensions can help with this, including:
pg_stat_statements for query analysis, and extensions that facilitate integration with external monitoring solutions.As your database workload evolves, periodically review and update your performance baselines to ensure they remain relevant. Significant changes in application behavior, data volume, or infrastructure might necessitate a new baseline.
Capturing performance baselines is a proactive step in database administration that enables you to quickly identify deviations from normal performance, making it easier to diagnose and resolve issues. By understanding the normal operational profile of your PostgreSQL database, you can more effectively troubleshoot performance issues, plan for capacity, and ensure optimal performance over time.
The post How to define and capture Baselines in PostgreSQL Performance Troubleshooting? appeared first on The WebScale Database Infrastructure Operations Experts in PostgreSQL, MySQL, MariaDB and ClickHouse.
The post How to define and capture Baselines in PostgreSQL Performance Troubleshooting? appeared first on MariaDB.org.
]]>The post Exploring Alternatives to SQL Server Query Store in PostgreSQL appeared first on MariaDB.org.
]]>pg_stat_statements extension with additional logging and monitoring tools. While PostgreSQL does not have a built-in feature identical to Query Store, pg_stat_statements and other tools can provide deep insights into query performance and help with performance tuning and troubleshooting.
The pg_stat_statements module is included with PostgreSQL and provides a means to track execution statistics of all SQL statements executed by the server, not just queries. This includes the number of times a statement was executed, the total time spent in the database for those executions, and more.
To use pg_stat_statements, you need to:
CREATE EXTENSION pg_stat_statements;
shared_preload_libraries in your postgresql.conf file to ensure it’s loaded at server start:
shared_preload_libraries = 'pg_stat_statements'
After changing the configuration, you’ll need to restart your PostgreSQL server.
pg_stat_statements view to analyze query performance:
SELECT query, calls, total_time, rows, 100.0 * shared_blks_hit / nullif(shared_blks_hit + shared_blks_read, 0) AS hit_percent
FROM pg_stat_statements
ORDER BY total_time DESC;
For a more comprehensive solution akin to SQL Server’s Query Store, consider integrating pg_stat_statements with other PostgreSQL features and third-party tools:
pg_qualstats, pg_stat_kcache, and auto_explain for deeper insights into query execution and performance issues. External monitoring tools like Prometheus with Grafana, or commercial platforms like pganalyze, provide powerful interfaces for visualizing and analyzing PostgreSQL performance data over time.pg_stat_statements with other PostgreSQL statistics.While PostgreSQL’s approach requires a bit more setup and integration work compared to SQL Server’s Query Store, it offers flexibility and powerful options for monitoring query performance and planning optimizations. The key is to leverage the pg_stat_statements extension as the foundation of your query performance analysis strategy and integrate it with other tools and practices for a comprehensive solution.
The post Exploring Alternatives to SQL Server Query Store in PostgreSQL appeared first on The WebScale Database Infrastructure Operations Experts in PostgreSQL, MySQL, MariaDB and ClickHouse.
The post Exploring Alternatives to SQL Server Query Store in PostgreSQL appeared first on MariaDB.org.
]]>The post Understanding the Internal Locking Hierarchy and Mechanisms in PostgreSQL appeared first on MariaDB.org.
]]>DROP DATABASE.ACCESS SHARE (used for SELECT operations), ROW SHARE (used for UPDATE, DELETE), ACCESS EXCLUSIVE (used for operations like DROP TABLE, TRUNCATE, which block all other operations), and several others. Each lock mode determines the compatibility with other lock modes.xmin and xmax system columns for each row (used for MVCC), and explicit row locks (SELECT FOR UPDATE, for example). Row-level locks offer the finest granularity, allowing high concurrency.PostgreSQL defines various lock modes, which determine whether different operations are compatible with each other. For example, multiple transactions can hold SHARE UPDATE EXCLUSIVE locks on a table simultaneously, but an ACCESS EXCLUSIVE lock is incompatible with any other lock, effectively serializing access to the resource.
PostgreSQL automatically detects deadlocks, situations where two or more transactions are waiting for each other to release locks. When detected, PostgreSQL will abort one of the transactions to break the cycle, allowing the other transactions to proceed.
Internally, PostgreSQL uses a lock table to manage most types of locks. The lock table maps lockable objects to the list of transactions holding or waiting for locks on them. For row-level locks, PostgreSQL uses a combination of predicate locks for Serializable transactions and lightweight locks or flags directly on rows for other isolation levels, minimizing overhead and maximizing performance.
PostgreSQL administrators can view lock information using system views like pg_locks, pg_class, and pg_stat_activity. These views can be queried to analyze current locks, which sessions are holding them, and potential locking issues.
Understanding the locking hierarchy and behavior in PostgreSQL is essential for database administration, performance tuning, and application development. Proper use of locks ensures data integrity and consistency while maximizing concurrency. Administrators and developers should design database operations with an understanding of lock compatibility and granularity to avoid unnecessary locking and potential performance issues.
The post Understanding the Internal Locking Hierarchy and Mechanisms in PostgreSQL appeared first on The WebScale Database Infrastructure Operations Experts in PostgreSQL, MySQL, MariaDB and ClickHouse.
The post Understanding the Internal Locking Hierarchy and Mechanisms in PostgreSQL appeared first on MariaDB.org.
]]>The post Why do We Need Databases and SQL? appeared first on MariaDB.org.
]]>The post Why do We Need Databases and SQL? appeared first on MariaDB.org.
]]>The post Help Us Improve MySQL Usability and Double Win! appeared first on MariaDB.org.
]]> What makes a great user experience? There are probably as many answers to this question as there are users because we are talking about very subjective and personal feelings and observations.While there are multiple experts at Percona, we also believe that one should not be forced to become a database expert to be able to […]
The post Help Us Improve MySQL Usability and Double Win! appeared first on MariaDB.org.
]]>The post Release Roundup March 4, 2024 appeared first on MariaDB.org.
]]>The post Release Roundup March 4, 2024 appeared first on MariaDB.org.
]]>The post Using Linux perf: do we need to pass identifying info as arguments to important functions? appeared first on MariaDB.org.
]]>perf to collect info about where the statement is spending its time.perf allows to record variables but for some reason it doesn’t allow to record this->member_var.this->name as arguments to “important” functions like sp_head::execute (run a stored routine). Should we?Longer:
Sometimes one has to analyze statement execution at a finer detail than ANALYZE FORMAT=JSON has. I was involved in such case recently: an UPDATE statement invoked a trigger which ran multiple SQL statements and invoked two stored functions. ANALYZE FORMAT=JSON showed that the top-level UPDATE statement didn’t have any issues. The issue was inside the trigger but where exactly?
We used Linux perf tool. In MariaDB (and MySQL) stored routine is executed by sp_head::execute(). One can track it like so:
# Add the probe:
perf probe -x `which mariadbd` --add _ZN7sp_head7executeEP3THDb
perf probe -x `which mariadbd` --add _ZN7sp_head7executeEP3THDb%return

# Collect a list of probes
PROBES=`perf probe -l 'probe_mariadb*' | awk '{ printf " -e %s", $1 } '`;

# Now, PROBES has " -e probe_mariadbd:_ZN7sp_head7executeEP3THDb
#    -e probe_mariadbd:_ZN7sp_head7executeEP3THDb__return"
then you can note your session’s thread id (TODO: does this work when using a thread pool?) :select tid from information_schema.processlist where id=connection_id();then have pref record the profile and run your query:
perf record $PROBES -t $THREAD_ID
^C

perf script
mariadbd 1625339 [005] 874721.854399: probe_mariadbd:_ZN7sp_head7executeEP3THDb: (55942da55c3a)
mariadbd 1625339 [005] 874722.855064: probe_mariadbd:_ZN7sp_head7executeEP3THDb__return: (55942da55c3a <- 55942da586eb)
mariadbd 1625339 [005] 874722.855102: probe_mariadbd:_ZN7sp_head7executeEP3THDb: (55942da55c3a)
mariadbd 1625339 [005] 874724.855253: probe_mariadbd:_ZN7sp_head7executeEP3THDb__return: (55942da55c3a <- 55942da586eb)
Column #4 is time in seconds. This is nice but it’s not possible to tell which SP is which.
perf allows access to local variables:
perf probe -x `which mariadbd` -V  _ZN7sp_head7executeEP3THDb%return
Available variables at _ZN7sp_head7executeEP3THDb%return
        @<execute+0>
                CSET_STRING     old_query
                Diagnostics_area*       da
                ...
                sp_head*        this
                ...
but when I’ve tried to record this->m_name.str, that failed:
perf probe -x `pwd`/mariadbd  --add '_ZN7sp_head7executeEP3THDb this->m_name.str'
Probe on address 0x880c3a to force probing at the function entry.

this is not a data structure nor a union.
  Error: Failed to add events.
What if the name of the stored function was passed as function argument? I edited MariaDB’s source code and added it (full diff):
--- a/sql/sp_head.cc
+++ b/sql/sp_head.cc
@@ -1192,7 +1192,7 @@
 */

 bool
-sp_head::execute(THD *thd, bool merge_da_on_success)
+sp_head::execute(THD *thd, bool merge_da_on_success, const char *sp_name)
 {
   DBUG_ENTER("sp_head::execute");
   char saved_cur_db_name_buf[SAFE_NAME_LEN+1];
Compiled, restarted the server and I was able to add a perf probe that records the name:
perf probe -x `pwd`/mariadbd
   --add '_ZN7sp_head7executeEP3THDbPKc sp_name:string'
perf record
^C
perf script
This produced (line breaks added by me):
    mariadbd 1627629 [003] 877069.642164: probe_mariadbd:_ZN7sp_head7executeEP3THDbPKc: (564e917f1c67)
      sp_name_string="test.func1"
    mariadbd 1627629 [003] 877070.642395: probe_mariadbd:_ZN7sp_head7executeEP3THDbPKc: (564e917f1c67)
      sp_name_string="test.func2"
sp_name_string shows which stored function was invoked.
The question: Should we now go now and add function arguments:
This would also help with crashing bugs – the stack trace would be informative. Currently the crash reports get benefit from dispatch_command() function, a random example from MDEV-22262:
#14 0x0000562e90545488 in dispatch_command ( ...
  packet=packet@entry=0x7efdf0007a19 "UPDATE t1 PARTITION (p1) SET a=3 WHERE a=8" ... )
but if the crash happened when running a Prepared Statement, one is out of luck.
The post Using Linux perf: do we need to pass identifying info as arguments to important functions? appeared first on MariaDB.org.
]]>The post Make SHOW as good as SELECT appeared first on MariaDB.org.
]]>SHOW AUTHORS GROUP BY `Location` INTO OUTFILE 'tmp.txt';
You’re thinking “Hold it, MySQL and MariaDB won’t allow SHOW (and similar statements like ANALYZE or CHECK or CHECKSUM or DESCRIBE or EXPLAIN or HELP) to work with the same clauses as SELECT, or in the same places.” You’re right — but they work anyway. “Eppur si muove”, as Galileo maybe didn’t say.
I’ll explain that the Ocelot GUI client transforms the queries so that this is transparent, that is, the user types such things where SELECTs would work, and gets result sets the same way that SELECT would do them.
I’ll call these statements “semiselects” because they do what a SELECT does — they produce result sets — but they can’t be used where SELECT can be used — no subqueries, no GROUP BY or ORDER BY or INTO clauses, no way to way to choose particular columns and use them in expressions.
There are three workarounds …
You can select from a system table, such as sys or information_schema or performance_schema if available and if you have the privileges and if their information corresponds to what the semiselect produces.
For the semiselects that allow WHERE clauses, you can use the bizarre “:=” assignment operator, such as
SHOW COLUMNS IN table_name WHERE (@field:=`Field`) > '';
and now @field will have one of the field values.
You can get the result set into a log file or copy-paste it, then write or acquire a program that parses, for example by extracting what’s between |s in a typical ASCII-decorated display.
Those three workarounds can be good solutions, I’m not going to quibble about their merits. I’m just going to present a method that’s not a workaround at all. You just put the semiselect where you’d ordinarily put a SELECT. It involves no extra privileges or globals or file IO.
CHECK TABLE c1, m WHERE `Msg_text` <> 'OK';

SELECT * FROM (DESCRIBE information_schema.tables) AS x ORDER BY 1;

SHOW COLLATION ORDER BY `Id` INTO OUTFILE 'tmp.txt';

SELECT `Type` FROM (SHOW COLUMNS IN Employees) AS x GROUP BY `Type`;

SELECT UPPER(`Name`) from (SHOW Contributors) as x;

SHOW ENGINES ORDER BY `Engine`;

(SELECT `Name` FROM (SHOW CONTRIBUTORS) AS x
UNION ALL SELECT `Name` FROM (SHOW AUTHORS) AS y)
ORDER BY 1;

CREATE TABLE engines AS SHOW ENGINES;
The client has to see where the semiselects are within the statement. That is easy, any client that can parse SQL can do it.
The client passes each semiselect to the server, and gets back a result, which ordinarily contains field names and values.
The client changes the field names and values to SELECTs, e.g. for SHOW CONTRIBUTORS the first row is
(SELECT 'Alibaba Cloud' AS `Name`, 'https://www.alibabacloud.com' AS `Location`, 'Platinum Sponsor of the MariaDB Foundation' AS `Comment")
and that gets UNION ALLed with the second row, and so on.
The client passes this SELECT to the server, and gets back a result as a select result set.
Or, in summary, what the client must do is: Pass the SHOW to the server, intercept the result, convert to a tabular form, send or SELECT … UNION ALL SELECT …; to the server, display.
However, these steps are all hidden. the user doesn’t have to care how it works.
It requires two trips to the server instead of one. The client log will only show the semiselect, but the server sees the SELECT UNION too.
It will not work inside routines. You will have to CREATE TEMPORARY TABLE AS semiselect; before invoking a routine, in order to use the semiselect’s result set inside CREATE FUNCTION | PROCEDURE | TRIGGER.
Speaking of CREATE TEMPORARY TABLE AS semiselect, if there are VARCHAR columns, they will only be as big as the largest item in the result set.
It will not work inside CREATE VIEW.
Sometimes it will not work with nesting, that is semiselects within semiselects might not be allowed.
Some rare situations will expose the SELECT result in very long column names.
On Linux this is easy — download libraries that ocelotgui needs, download ocelotgui, cmake, make. (On Windows it’s not as easy, sorry.) The source, and the README instructions for building, are on github.
After you’ve started up ocelotgui and connected to a MySQL or MariaDB server, there is one preparatory step: you have to enable the feature. (It’s not default because these aren’t standard SQL statements.) You can do this by going to the Settings|Statement menu and changing the Syntax Checker value to 7 and clicking OK. Or you can enter the statement
SET OCELOT_STATEMENT_SYNTAX_CHECKER = '7';
Now the feature is enabled and you can try all the examples I’ve given. You’ll see that they all work.
Of course it’s made available this way because the status is beta.
This will be available in executable form in the next release of ocelotgui, real soon now. If you have a github account, you can go to the github page and click Watch to keep track of updates.
The post Make SHOW as good as SELECT appeared first on MariaDB.org.
]]>The post Implement advanced replication features with Amazon RDS for MySQL and Amazon Aurora MySQL using intermediate replication servers appeared first on MariaDB.org.
]]>We discuss two replication capabilities in Amazon RDS and Amazon Aurora: multi-source replication and replication filtering. Multi-source replication is supported only in Amazon RDS for MySQL (8.0.35 and higher minor version and 5.7.44 and higher minor versions) but at the time of writing this post, it’s not supported for Aurora. We then implement those capabilities using an intermediate MySQL replication instance (a relay server) running in Amazon Elastic Compute Cloud (Amazon EC2).
A MySQL replication topology begins with a primary database server receiving write traffic and recording equivalent replication events in the binary log (or binlog). The binary log events describe all changes that happen on the primary server. Replicas connect to the primary server, download the binary logs, and apply the events locally in order to synchronize themselves with the primary.
In the most common scenario, the primary server records all changes, and each replica receives and applies all changes from a single primary. This is sufficient in most scenarios, but advanced use cases may require a tailored approach where the replicas aren’t simply one-to-one mirrors of the primary database.
Multi-source replication enables data from multiple MySQL-compatible sources to replicate to a single target (replica). Multi-source replication can facilitate a variety of use cases, including the following:
In our solution we are using an intermediate replication instance, which reads the binary log streams from multiple sources and produces a single replication stream that can be consumed by Amazon Aurora MySQL or Amazon RDS for MySQL.
The following diagram shows multiple MySQL databases instances being used as a source and replicating to another MySQL instance using an intermediate instance.

Replication filtering allows database administrators to exclude schemas or tables from replication. The configuration is flexible: you can list objects that should be replicated (and ignore everything else), or list objects that should be ignored (and replicate everything else). You can also choose to apply the filtering rules on the source or on the target.
Replication filtering can be helpful in the following situations:
Replication filtering is partially supported in Amazon Aurora MySQL and Amazon RDS for MySQL. Consult the user guides for Amazon RDS and Amazon Aurora for details. At the time of writing, feature limitations include the following:
--binlog-do-db and --binlog-ignore-db parameters aren’t supportedmysql schema can’t be ignoredThe solution outlined in this post allows you to bypass these limitations.
The BLACKHOLE storage engine is an alternative way of implementing replication filtering at a table level. In this approach, a table converted to the BLACKHOLE engine ignores all writes and doesn’t contain any data. The binary log format (STATEMENT or ROW) determines whether or not replication records are written to the binary log, and therefore whether the intermediate replication instance sends these records further down the replication stream. This post includes a BLACKHOLE example for completeness. However, due to the relative complexity of BLACKHOLE behavior, we recommend using the replication filtering parameters instead where possible.
The following diagram shows a MySQL database instance being used as a source and replicating to another MySQL instance using an intermediate instance that is using the BLACKHOLE engine.

You can use the aforementioned replication features individually, or you can run a combination of filtering, multi-source replication, and BLACKHOLE tables on the same intermediate replication instance. The intermediate instance acts as a processing layer that replicates from binary log sources, applies the desired operations (multi-source aggregation, filtering), and generates new binary logs of its own. This new binary logs stream can then be consumed by Amazon Aurora MySQL or Amazon RDS for MySQL.
You need the following components to implement this solution:
Note that for replication to work reliably throughout the entire chain, all MySQL servers must be replication-compatible in terms of their versions and configuration. For example, MySQL supports replication to the next higher major version (for example, 5.7 to 8.0), but doesn’t officially support replication from a higher to a lower major version. Similarly, the gtid_mode configuration must be compatible across all servers.
In this post, the test databases start out empty and aren’t receiving any write traffic until after replication is configured. Consequently, there’s no need to synchronize binary log positions between the servers, and we can use the current positions without running into replication conflicts. In real-world migration scenarios where the intermediate and target servers are provisioned from physical backups or logical dumps, you must ensure the binary log positions are correct in the context of those backups and dumps.
The examples provided in this post were tested using MySQL 8.0 and Amazon Aurora MySQL version 3 (compatible with MySQL 8.0).
MySQL servers acting as a replication source must meet the following configuration requirements:
REPLICATION SLAVE permissions, which will be used to accept replication connections from the intermediate server.The exact steps will vary depending on whether you’re working with a managed MySQL service or a self-managed database.
If you don’t have existing MySQL servers you could use to test this solution, you can provision one or more RDS for MySQL instances by completing the following steps:

REPLICATION SLAVE permissions:
Complete the following steps to provision the intermediate MySQL instance:
At this time, you can make additional MySQL configuration changes according to your requirements. At a minimum, verify the following prerequisites:
ROW format (binlog_format setting). This should be the default in MySQL 8.0.The examples in this post don’t require advanced MySQL tuning, but production use cases might require adjustments to the instance sizing as well as MySQL buffers, caches, and other configuration values that influence the performance and behavior of the server.
The target preparation steps depend on the nature of your project. Migration projects might create the target database from a backup; others might start with an empty database to be filled with data after creation.
If you don’t already have a target database to use with this solution, you can create a new Aurora MySQL cluster. Make sure to use a major engine version that’s compatible with the MySQL version of the intermediate EC2 instance. For example, if using MySQL 8.0 on the EC2 instance, use Amazon Aurora MySQL version 3.
We now configure multi-source replication between the two RDS for MySQL source instances and the intermediate MySQL server we created in the preceding section.
Multi-source replication uses the concept of replication channels, with each channel connecting to a different binary log source. Note that MySQL doesn’t perform automatic conflict resolution for changes coming from multiple sources, which means that the changes must be non-conflicting for the replication to work.
Use the CHANGE REPLICATION SOURCE TO statement to configure each channel. In MySQL versions before 8.0.23, the equivalent command is CHANGE MASTER TO.
This example involves two RDS for MySQL source instances, so the setup requires the creation of two replication channels.
To configure multi-source replication, complete the following steps:
source-mysql-instance-1, use the following code:
source-mysql-instance-2, use the following code:
source-mysql-instance-1:
source-mysql-instance-2:
As the final step in our setup, we configure replication from the intermediate MySQL server to the Amazon Aurora MySQL target:
SHOW REPLICA STATUS command as demonstrated previously:
At this point, binary log replication is up and running between all three database layers: the Amazon RDS for MySQL sources, the intermediate MySQL server in Amazon EC2, and the Amazon Aurora MySQL target. Let’s proceed with the demonstration of replication features.
To demonstrate multi-source replication, we create a schema with a couple of tables on each of the RDS for MySQL source instances. The objects are replicated to the intermediate MySQL server in Amazon EC2, so that the server sees both schemas, each replicated from a different source. Complete the following steps:
source-mysql-instance-1:
source-mysql-instance-2. Make sure to use a different schema name, so that it doesn’t conflict with the schema we created in the previous step:
Building upon our existing replication setup, we now introduce replication filtering to ignore certain tables on the intermediate MySQL server. Let’s say that one of the source instances (source-mysql-instance-1) runs regular data archiving jobs on tables called demo_source1_db.archive_*. We still want those tables to be binary logged for other reasons (like backup and restore), but we don’t need them in our Amazon Aurora MySQL target.
We use our intermediate MySQL server to filter those tables out, so that the Aurora MySQL cluster never has to process them. Complete the following steps:
/etc/my.cnf) and add the following setting, then restart the MySQL service:
source-mysql-instance-1 and create a table that’s matched by the replication filtering rule:
The same is true on the Aurora MySQL cluster. Although we didn’t configure any replication filtering rules on the Aurora side, the events for the filtered table were already ignored on the intermediate database, and they never made it to the Aurora cluster.
There are several replication filtering parameters that you can use according to your requirements. Filtering settings can list objects that should be replicated (and ignore everything else), or list objects that should be ignored (and replicate everything else).
Note that if you configure multiple filtering settings, there’s a specific order in which the server evaluates them. This can sometimes lead to unexpected results, such as when the same table names are listed in both the do and the ignore parameters. Refer to How Servers Evaluate Replication Filtering Rule for details.
BLACKHOLE storage engineAs the final step in our demonstration, let’s take one of the tables that have already been replicated and convert that table to BLACKHOLE storage engine. We then observe how it affects replication on that table.
source-mysql-instance-1 and insert a few rows into one of the tables:
BLACKHOLE engine on the intermediate MySQL server. Note that we want to modify the table on the intermediate server, but we want the table to stay on InnoDB in the Aurora cluster. To achieve that, we’re using the session-level sql_log_bin variable to temporarily disable binary logging while we’re altering the table:
At this point, the table is a regular InnoDB table on the Amazon RDS for MySQL source and in Amazon Aurora MySQL, but it’s a BLACKHOLE table on the intermediate server. Let’s see how that affects replication.
source-mysql-instance-1, insert a couple more rows into the table:
BLACKHOLE engine:
source-mysql-instance-1 and delete all the rows from the table:
Out of all the changes initially made on the source, the inserted rows made it to the target, but the deletes did not. This is due to the following reasons:
InnoDB, so it accepted and logged the inserts normally.BLACKHOLE tables are always logged, regardless of the binary log format. Because the inserts were logged, Aurora received and replicated them.ROW, so it didn’t record those deletes in its binary log. That’s because the BLACKHOLE engine treats updates and deletes differently than inserts. Refer to Replication and BLACKHOLE Tables for details.This demonstration shows why BLACKHOLE tables might be seen as unpredictable in complex replication setups. For that reason, we recommend using replication filtering instead of the BLACKHOLE engine where possible. Nevertheless, BLACKHOLE tables are an interesting concept and might be useful in scenarios that can take advantage of their unique characteristics.
In this post, we demonstrated how you can use advanced replication features by inserting an intermediate replication component between two MySQL servers. This technique can be very useful in situations when the source or target servers are constrained in their features or configuration options, or when you want to perform data transformations such as schema aggregation or data filtering without having to modify the source databases directly.
We hope you find this post helpful, please let us know your thoughts and questions in the comment section.
 Shyam Sunder Rakhecha is a Lead Consultant with the Professional Services team at AWS based out of Hyderabad, India, and specializes in database migrations and modernization. He helps customers in migration and optimization in the AWS Cloud. He is curious to explore emerging technology in terms of databases. He is fascinated with RDBMS and big data. He also loves to organize team building events and activities.
 Neha Sharma is a Database Consultant with Amazon Web Services. With over a decade of experience in working with databases, she enables AWS customers to migrate their databases to AWS Cloud. Besides work, she likes to be actively involved in various sports activities and likes to socialize with people.
 Szymon Komendera is a Database Solutions Architect at AWS, with nearly 20 years of experience in databases, software development, and application availability. He spent the majority of his 8-year AWS tenure developing Aurora MySQL, and supporting other AWS databases such as Amazon Redshift and Amazon ElastiCache.
The post Implement advanced replication features with Amazon RDS for MySQL and Amazon Aurora MySQL using intermediate replication servers appeared first on MariaDB.org.
]]>The post Notable optimizer fixes released in February, 2024 appeared first on MariaDB.org.
]]>This is a follow-up to MDEV-32203 I’ve covered for the previous release: MariaDB now emits a warning for conditions in form indexed_column CMP_OP const that are not unusable for the optimizer. The most common case where they are not usable is varchar_column=INTEGER_CONSTANT but there are less obvious cases as well, like mismatched collations.
The original patch failed to produce the warning in some some cases. Now, this is fixed.
Writing varchar_col=INTEGER_CONSTANT looks like a newbie mistake, but it is not. I’ve encountered several such cases in the last couple of months alone. They were in fairly complex and well-written queries. MDEV-32203 was a good idea.
This is added to address poor join query plans. Consider a query plan using ref access:
select * from t1, t2 where t2.key1=t1.col1 and t2.key2='foo'
+------+-------------+-------+------+---------------+------+---------+---------+------+-------------+
| id   | select_type | table | type | possible_keys | key  | key_len | ref     | rows | Extra       |
+------+-------------+-------+------+---------------+------+---------+---------+------+-------------+
|    1 | SIMPLE      | t1    | ALL  | NULL          | NULL | NULL    | NULL    | 1000 | Using where |
|    1 | SIMPLE      | t2    | ref  | key1          | key1 | 5       | t1.col1 | 200  | Using where |
+------+-------------+-------+------+---------------+------+---------+---------+------+-------------+
When computing cost of reading table t2 by doing index lookups using t2.key1=t1.col1, MariaDB tried to take into account that some of the reads would hit the cache. Basically, the total cost of all lookups was capped by “worst_seeks” value which was a function of how much we would read from table t2 if we read its matching rows “independently” of table t1.
However this cap didn’t apply for all possible ref accesses. ref accesses that have a constant key part (like t2.key2='foo' in this example) “borrowed” #rows and cost estimate from the range optimizer, and that number was not capped.
This resulted in very poor query plan choices in some scenarios. The visible effect was that the optimizer picked an obviously bad ref access plan when a better option was clearly present.
Another related issue was the relative costs of clustered index scans and secondary index scans. Secondary index scans cost was too low.
Both of these issues are fixed in The Big Cost Model Rewrite in MariaDB 11.0. But if one can’t upgrade to 11.0 yet, they can get these fixes in MariaDB 10.6+ by setting optimizer_adjust_secondary_key_costs accordingly.
MariaDB (and MySQL) has two datatypes for storing points in time: TIMESTAMP and DATETIME.
DATETIME is “YYYY-MM-DD HH:MM:SS” value, without specifying which time zone it is in.
TIMESTAMP is a point in time. It is “the number of [micro]seconds since midnight January 1st, 1970 GMT”. When you read a TIMESTAMP column, it is converted to ‘YYYY-MM-DD …’ datetime in your local @@session.time_zone.
Consider Query-1 which compares a timestamp column with a datetime literal:
SELECT ... FROM tbl WHERE timestamp_column <= 'YYYY-MM-DD ...'
Here, for each row considered, MariaDB would convert the value of timestamp_column into a DATETIME structure consisting of Year, Month, Date, …. and then compare it with the DATETIME structure representing ‘YYYY-MM-DD…’. But if TIMESTAMPs are just integers, why not compare as TIMESTAMPs instead?
This is surprisingly complex. First, DATETIME values have a wider range: they span from year 0000 to 9999 while TIMESTAMP covers only 1970 to 2038. Second, DST time changes mean that some DATETIME values map to two possible TIMESTAMP points-in-time: one before the clock is moved backwards, and one after. When the clock is moved forward, there are DATETIME values that do not map to any TIMESTAMP.
The patch for MDEV-32148 carefully takes all these limitations into account and makes queries like Query-1 use TIMESTAMP comparisons whenever it’s safe.
The post Notable optimizer fixes released in February, 2024 appeared first on MariaDB.org.
]]>The new MyEnv can be downloaded here. How to install MyEnv is described in the MyEnv Installation Guide.
In the inconceivable case that you find a bug in the MyEnv please report it to the FromDual bug tracker.
Any feedback, statements and testimonials are welcome as well! Please send them to feedback@fromdual.com.
Upgrade from 1.1.x to 2.0
Please look at the MyEnv 2.0.0 Release Notes.
Upgrade from 2.0.x to 2.1.0
shell > cd ${HOME}/product
shell > tar xf /download/myenv-2.1.0.tar.gz
shell > rm -f myenv
shell > ln -s myenv-2.1.0 myenv
Plug-ins
If you are using plug-ins for showMyEnvStatus create all the links in the new directory structure:
shell > cd ${HOME}/product/myenv
shell > ln -s ../../utl/oem_agent.php plg/showMyEnvStatus/
Upgrade of the instance directory structure
From MyEnv 1.0 to 2.0 the directory structure of instances has fundamentally changed. Nevertheless MyEnv 2.0 works fine with MyEnv 1.0 directory structures.
Changes in MyEnv 2.1.0
MyEnv
Removed hard coded parts for running MyEnv under O/S user mariadb.
Function substitute_path was refactored.
Branch guessing improved.
Warnings and errors are in color now.
MyEnv log file is now touched to avoid problems with O/S user root.
O/S user mysql removed in start/stop script.
Checks for DB start improved.
/var/run replaced by the more modern location /run.
Should now be completely MariaDB compatible (mariadbd vs. mysqld).
Wrapper mysqld_safe was extended to mariadbd-safe.
Replaced getVersionFromMysqld by getVersionAndBranchFromDaemon and extended functionality of this function.
LD_LIBRARY_PATH was set to the wrong directory.
Reverting Commit: fcc93c5 from v2.0.3 related to CDPATH. Break commands like cd log or cd etc.
Database mysql_innodb_cluster_metadata is hidden now.
Database #innodb_redo is suppressed now as well for MySQL 8.0, and hideschema is not added to every new instance any more to not overwrite the default.
Bug while stopping instance with missing my.cnf fixed.
Function getDistribution cleaned-up.
MySQL should now also be detected correctly from Ubuntu repository.
Function my_exec rewritten.
Debian GNU/Linux tag added for distros.
Function extractBranch made better to work on Debian and Ubuntu with distribution packages.
Oracle Linux is considered as well now.
Made scripts ready for new MariaDB behaviour.
my.cnf template adapted to newest knowledge.
Directory changed from /tmp to /var/tmp, code cleaned-up and renewal, PID file code and message improved in stopInstance.
Distributions cleaned-up and cloudlinux, rocky linux and almalinux added as centos compatible distros.
MyEnv Installer
Debian 10 and 11 do not support PHP 8.0 yet, fixed.
Unit file is copied now correctly.
MyEnv instance installation is automatizable now.
Instance creation automation added.
my.cnf template together with installMyenv should now work without errors or warnings for MariaDB 10.5 - 11.2 and MySQL 8.0 - 8.3.
Command yum replaced by dnf.
Command apt-get comments replaced by apt.
MyEnv Utilities
Client utility adapted in *monitor scripts.
InnoDB cluster monitor added.
wsrep_last_committed was added in galera_monitor.sh.
AWR added, sharding stuff added, lock and trx analysis scripts added.
Memory analysis added, NUMA maps output made ready for new variables.
connect_maxout utility added.
For subscriptions of commercial use of MyEnv please get in contact with us.
Taxonomy upgrade extras: MyEnvmulti-instancevirtualizationconsolidationSaaSOperationsreleasemysqld_multi
The post Shinguz: MariaDB/MySQL Environment MyEnv 2.1.0 has been released appeared first on MariaDB.org.
]]>FromDual has the pleasure to announce the release of the new version 2.1.0 of its popular MariaDB, Galera Cluster and MySQL multi-instance environment MyEnv.
The new MyEnv can be downloaded here. How to install MyEnv is described in the MyEnv Installation Guide.
In the inconceivable case that you find a bug in the MyEnv please report it to the FromDual bug tracker.
Any feedback, statements and testimonials are welcome as well! Please send them to feedback@fromdual.com.
Please look at the MyEnv 2.0.0 Release Notes.
shell> cd ${HOME}/product
shell> tar xf /download/myenv-2.1.0.tar.gz
shell> rm -f myenv
shell> ln -s myenv-2.1.0 myenv
If you are using plug-ins for showMyEnvStatus create all the links in the new directory structure:
shell> cd ${HOME}/product/myenv
shell> ln -s ../../utl/oem_agent.php plg/showMyEnvStatus/
From MyEnv 1.0 to 2.0 the directory structure of instances has fundamentally changed. Nevertheless MyEnv 2.0 works fine with MyEnv 1.0 directory structures.
mariadb.substitute_path was refactored.root.mysql removed in start/stop script./var/run replaced by the more modern location /run.mariadbd vs. mysqld).mysqld_safe was extended to mariadbd-safe.getVersionFromMysqld by getVersionAndBranchFromDaemon and extended functionality of this function.LD_LIBRARY_PATH was set to the wrong directory.CDPATH. Break commands like cd log or cd etc.mysql_innodb_cluster_metadata is hidden now.#innodb_redo is suppressed now as well for MySQL 8.0, and hideschema is not added to every new instance any more to not overwrite the default.my.cnf fixed.getDistribution cleaned-up.my_exec rewritten.extractBranch made better to work on Debian and Ubuntu with distribution packages.my.cnf template adapted to newest knowledge./tmp to /var/tmp, code cleaned-up and renewal, PID file code and message improved in stopInstance.my.cnf template together with installMyenv should now work without errors or warnings for MariaDB 10.5 – 11.2 and MySQL 8.0 – 8.3.yum replaced by dnf.apt-get comments replaced by apt.*monitor scripts.wsrep_last_committed was added in galera_monitor.sh.connect_maxout utility added.For subscriptions of commercial use of MyEnv please get in contact with us.
The post Shinguz: MariaDB/MySQL Environment MyEnv 2.1.0 has been released appeared first on MariaDB.org.
]]>The new MyEnv can be downloaded here. How to install MyEnv is described in the MyEnv Installation Guide.
In the inconceivable case that you find a bug in the MyEnv please report it to the FromDual bug tracker.
Any feedback, statements and testimonials are welcome as well! Please send them to feedback@fromdual.com.
Upgrade from 1.1.x to 2.0
Please look at the MyEnv 2.0.0 Release Notes.
Upgrade from 2.0.x to 2.1.0
shell > cd ${HOME}/product
shell > tar xf /download/myenv-2.1.0.tar.gz
shell > rm -f myenv
shell > ln -s myenv-2.1.0 myenv
Plug-ins
If you are using plug-ins for showMyEnvStatus create all the links in the new directory structure:
shell > cd ${HOME}/product/myenv
shell > ln -s ../../utl/oem_agent.php plg/showMyEnvStatus/
Upgrade of the instance directory structure
From MyEnv 1.0 to 2.0 the directory structure of instances has fundamentally changed. Nevertheless MyEnv 2.0 works fine with MyEnv 1.0 directory structures.
Changes in MyEnv 2.1.0
MyEnv
Removed hard coded parts for running MyEnv under O/S user mariadb.
Function substitute_path was refactored.
Branch guessing improved.
Warnings and errors are in color now.
MyEnv log file is now touched to avoid problems with O/S user root.
O/S user mysql removed in start/stop script.
Checks for DB start improved.
/var/run replaced by the more modern location /run.
Should now be completely MariaDB compatible (mariadbd vs. mysqld).
Wrapper mysqld_safe was extended to mariadbd-safe.
Replaced getVersionFromMysqld by getVersionAndBranchFromDaemon and extended functionality of this function.
LD_LIBRARY_PATH was set to the wrong directory.
Reverting Commit: fcc93c5 from v2.0.3 related to CDPATH. Break commands like cd log or cd etc.
Database mysql_innodb_cluster_metadata is hidden now.
Database #innodb_redo is suppressed now as well for MySQL 8.0, and hideschema is not added to every new instance any more to not overwrite the default.
Bug while stopping instance with missing my.cnf fixed.
Function getDistribution cleaned-up.
MySQL should now also be detected correctly from Ubuntu repository.
Function my_exec rewritten.
Debian GNU/Linux tag added for distros.
Function extractBranch made better to work on Debian and Ubuntu with distribution packages.
Oracle Linux is considered as well now.
Made scripts ready for new MariaDB behaviour.
my.cnf template adapted to newest knowledge.
Directory changed from /tmp to /var/tmp, code cleaned-up and renewal, PID file code and message improved in stopInstance.
Distributions cleaned-up and cloudlinux, rocky linux and almalinux added as centos compatible distros.
MyEnv Installer
Debian 10 and 11 do not support PHP 8.0 yet, fixed.
Unit file is copied now correctly.
MyEnv instance installation is automatizable now.
Instance creation automation added.
my.cnf template together with installMyenv should now work without errors or warnings for MariaDB 10.5 - 11.2 and MySQL 8.0 - 8.3.
Command yum replaced by dnf.
Command apt-get comments replaced by apt.
MyEnv Utilities
Client utility adapted in *monitor scripts.
InnoDB cluster monitor added.
wsrep_last_committed was added in galera_monitor.sh.
AWR added, sharding stuff added, lock and trx analysis scripts added.
Memory analysis added, NUMA maps output made ready for new variables.
connect_maxout utility added.
For subscriptions of commercial use of MyEnv please get in contact with us.
Taxonomy upgrade extras: MyEnvmulti-instancevirtualizationconsolidationSaaSOperationsreleasemysqld_multi
The post MariaDB/MySQL Environment MyEnv 2.1.0 has been released appeared first on MariaDB.org.
]]>FromDual has the pleasure to announce the release of the new version 2.1.0 of its popular MariaDB, Galera Cluster and MySQL multi-instance environment MyEnv.
The new MyEnv can be downloaded here. How to install MyEnv is described in the MyEnv Installation Guide.
In the inconceivable case that you find a bug in the MyEnv please report it to the FromDual bug tracker.
Any feedback, statements and testimonials are welcome as well! Please send them to feedback@fromdual.com.
Please look at the MyEnv 2.0.0 Release Notes.
shell> cd ${HOME}/product
shell> tar xf /download/myenv-2.1.0.tar.gz
shell> rm -f myenv
shell> ln -s myenv-2.1.0 myenv
If you are using plug-ins for showMyEnvStatus create all the links in the new directory structure:
shell> cd ${HOME}/product/myenv
shell> ln -s ../../utl/oem_agent.php plg/showMyEnvStatus/
From MyEnv 1.0 to 2.0 the directory structure of instances has fundamentally changed. Nevertheless MyEnv 2.0 works fine with MyEnv 1.0 directory structures.
mariadb.substitute_path was refactored.root.mysql removed in start/stop script./var/run replaced by the more modern location /run.mariadbd vs. mysqld).mysqld_safe was extended to mariadbd-safe.getVersionFromMysqld by getVersionAndBranchFromDaemon and extended functionality of this function.LD_LIBRARY_PATH was set to the wrong directory.CDPATH. Break commands like cd log or cd etc.mysql_innodb_cluster_metadata is hidden now.#innodb_redo is suppressed now as well for MySQL 8.0, and hideschema is not added to every new instance any more to not overwrite the default.my.cnf fixed.getDistribution cleaned-up.my_exec rewritten.extractBranch made better to work on Debian and Ubuntu with distribution packages.my.cnf template adapted to newest knowledge./tmp to /var/tmp, code cleaned-up and renewal, PID file code and message improved in stopInstance.my.cnf template together with installMyenv should now work without errors or warnings for MariaDB 10.5 – 11.2 and MySQL 8.0 – 8.3.yum replaced by dnf.apt-get comments replaced by apt.*monitor scripts.wsrep_last_committed was added in galera_monitor.sh.connect_maxout utility added.For subscriptions of commercial use of MyEnv please get in contact with us.
The post MariaDB/MySQL Environment MyEnv 2.1.0 has been released appeared first on MariaDB.org.
]]>The post The most noteworthy improvements in MariaDB 10.11 appeared first on MariaDB.org.
]]>The PUBLIC pseudo-role allows the following SQL statements to be implemented:
GRANT TO PUBLIC – Grants some privileges to all users.REVOKE FROM PUBLIC – Revokes privileges from PUBLIC. However, roles and users that have explicitly been granted those privileges will retain them.SHOW GRANT FOR PUBLIC – Shows the GRANT statement that can be used to restore PUBLIC permissions.A typical use case for PUBLIC would be an instance where you want all users to have UPDATE privileges on a certain table.
Usually in replicas, we set the read_only=1 to make MariaDB instances read-only to ensure that no accidental writes are done on replicas. However, there are instances where a DBA might need to change data on replicas due to inconsistencies with the primary. In previous MariaDB versions, the SUPER or READ-ONLY ADMIN privileges were required to write data into a replica. Now, to write on read-only instances, the READ-ONLY ADMIN privilege is necessary and the SUPER privilege is not allowed to.
MariaDB’s unix_socket plugin in Linux systems allows the binding of one system user to MariaDB users. This allows for passwordless authentication for a system user to the MariaDB instance, eliminating the need for double authentication (MariaDB and system). With MariaDB 10.11, the GSSAPI authentication plugin is included in the server — this allows for the same passwordless local authentication in Windows.
Some InnoDB performance enhancements were also introduced via easier configuration tuning.
innodb_undo_tablespaces determines the number of InnoDB undo logs. In previous MariaDB versions, the default value was 0, which meant the undo log was written into the system tablespace. However, with MariaDB 10.11, the default value is 3. This means that there are three undo logs, and each is written in the defined innodb_undo_directory. The most significant aspect is that in previous versions the innodb_undo_tablespaces value could not be changed after database creation and one wouldn’t try to find the optimal value..
The InnoDB background IO threads are represented by the innodb_write_io_threads and innodb_read_io_threads variables. In the previous versions, these variables were not dynamic and changes required a MariaDB restart. In MariaDB 10.11 these variables are now dynamic and do not require a restart.
INSERTS.innodb_change_buffering is now deprecated and ignored.innodb_log_file_size is now dynamic.innodb_buffer_pool_chunk_size is now allocated dynamically.FULLTEXT searches can now find words with apostrophes, like O’Connor.MariaDB introduced temporal tables in 2018. MariaDB 10.11 includes improvements on a temporal table called system-versioned tables. These tables use row versioning which is controlled by MariaDB automatically. These tables preserve past data that allows running queries on the tables to show how data has evolved or was at a certain point in time.
Previously, system-versioned tables’ history could not be modified until now thus it was impossible to take mariadb-dump and restore it. The following changes have been made:
system_versioning_insert_history variable was added. It is set to OFF by default. But it’s dynamic and, if enabled, allows the insertion of past versions rows, with specified timestamps. Without this option, we could take a dump but not restore it.DELETEs and UPDATEs with semi-joins are now properly optimized. Previously, it was recommended to use multi-table syntax with DELETE and UPDATE. These are some of the improvements done to the information_schema database which contains informational systems tables. In previous versions, queries executed on PARAMETERS and ROUTINES run with a full table scan, even if there was a WHERE clause used that was specific and efficiently used an index — this behavior has been modified.
Previously, queries executed on PARAMETERS and ROUTINES loaded all examined procedure codes, which translated to slowness, especially in the case of a full table scan. Now, if the query only returns procedures’ and parameters’ names, the procedure codes are not loaded.
One issue with variable names is that they are not always grouped cleanly. From MariaDB 10.11, we can see all variables that affect the slow query log by running SHOW VARIABLES LIKE ‘slow_log%’;. The slow_log prefix has been added to the following variables:
min_examined_row_limitslow_query_logslow_query_log_fileLong_query_timeTo instruct a replica to change a database name we use replicate_rewrite_db. This is often done to replicate a test database. Previously, this was a startup option that could be specified on startup. This implies that the service configuration must be modified which is not a good idea. Services should only be modified to change the start/stop/restart logic. Now, the corresponding variable exists as a dynamic system variable.
The above are some of the more interesting features introduced in MariaDB 10.11. If you want to see the full list of improvements, you can go here.
With ClusterControl, you can easily upgrade to MariaDB 10.11 stress-free. Go to our MariaDB on ClusterControl page to see all of the ops features available to you. Once familiar, see how ClusterControl gives you unprecedented control in administering MariaDB in any environment — try our free 30 day trial, no CC required. In the meantime, stay up to date with all the latest news and best practices for the most popular open-source databases by following us on Twitter and LinkedIn, or subscribing to our monthly newsletter below.
The post The most noteworthy improvements in MariaDB 10.11 appeared first on Severalnines.
The post The most noteworthy improvements in MariaDB 10.11 appeared first on MariaDB.org.
]]>The post Webinar recording: Mastering Galera Cluster, Best Practices and New Features appeared first on MariaDB.org.
]]>What You Will Learn:
* Core Best Practices: Dive into essential practices, from employing primary keys and leveraging InnoDB to deciding if to optimise read/write splits and managing AUTO_INCREMENT settings.
* Advanced Configuration: Uncover advanced techniques for error monitoring, configuring Galera across networks, and fine-tuning the gcache for optimal performance. * Innovative Features: Stay ahead with insights on implementing Non-Blocking Operations for seamless schema changes, coordinating distributed transactions with XA transactions, and securing your GCache through encryption.
* Protocol and Network Enhancements: Discover the latest advancements in handling unstable networks, protocol improvements, and explore new options to elevate your cluster operations.
Have in-depth questions or faced intricate production challenges? This extended Q&A session is your opportunity to seek advice, clarify doubts, and engage directly with Galera Cluster experts.
The post Webinar recording: Mastering Galera Cluster, Best Practices and New Features appeared first on MariaDB.org.
]]>The post Trigger an AWS Lambda function from Amazon RDS for MySQL or Amazon RDS for MariaDB using audit logs and Amazon CloudWatch appeared first on MariaDB.org.
]]>In this post, we show you how to invoke Lambda functions from Amazon Relational Databases Service (Amazon RDS) for MySQL and Amazon RDS for MariaDB using Amazon CloudWatch and messages published in audit logs. The same architecture can also be used with Amazon Aurora MySQL-Compatible Edition.
This solution consists of publishing RDS for MySQL or MariaDB audit logs to a CloudWatch log group, and creating a CloudWatch subscription filter for Lambda to trigger a Lambda function.
The following diagram illustrates the solution architecture and flow.

In this solution, audit logs generated by Amazon RDS for MySQL or Amazon RDS for MariaDB are published to a CloudWatch log group. The CloudWatch subscription filter filters the logs based on a user-defined pattern—when there is a pattern match, the subscription filter triggers the specified Lambda function and sends the log event to the Lambda function.
The logs received are base64 encoded and compressed with gzip format. We show you how to decode the log event to only get the desired payload for the Lambda function.
To deploy the solution, we complete the following steps (corresponding to the numbered components in the architecture diagram):
To follow along with this post, you should have an RDS for MySQL or MariaDB database instance for which you wish to trigger the Lambda function. For this post, our DB instance is named Lambda-trigger-mariadb. For instructions to create an RDS instance, refer to Create a RDS Instance.
In this step, we create a table with the same name as the Lambda function we need to trigger, with a single column to insert the JSON payload for the Lambda function. Complete the following steps to create your table:
You can capture DML queries running in the RDS instance by enabling audit logs. Unlike error logs, general logs, and slow query logs, there is no direct parameter in the parameter group to enable audit logs. You must use the MariaDB Audit Plugin using an option group to enable auditing in your RDS for MySQL or MariaDB instance. Complete the following steps:
You can enable audits logs in Amazon Aurora MySQL from the DB cluster parameter group by setting the parameter server_audit_logging to 1. Refer to Configuring an audit log to capture database activities for Amazon RDS for MySQL and Amazon Aurora with MySQL compatibility for detailed steps.
After you have enabled audit logs on the RDS instance, the logs are listed on the Amazon RDS console in the Logs section on the instance details page, as shown in the following screenshot.

Now we need to publish the logs to CloudWatch. Complete the following steps:

After you publish the audit logs to CloudWatch, the log group is listed on the CloudWatch console with the naming convention aws/rds/instance/<database-name>/audit.
To create your Lambda function, complete the following steps:
MyLambda).Note that the invocation payload size for an asynchronous Lambda function is 256 KB. For more details, refer to Lambda quotas.
A CloudWatch subscription filter lets you filter log data coming from a CloudWatch log group based on the terms or pattern you design and send it to Amazon Kinesis Data Streams, Amazon Kinesis Data Firehose, or Lambda. For this post, we create a filter on the audit logs for any INSERT operation that happens in the table named MyLambda. You can choose any tables or filter pattern published in the audit logs as needed for your use case.
Complete the following steps to create a CloudWatch subscription filter:
aws/rds/instance/<database-name>/audit).
Note Subscription filter is case-sensitive. It is not possible to add more than one pattern for a given filter; however, you can add more than one subscription filter in a log group.
MyInsertFilter
Lambda-trigger-mariadb).Note that the test pattern only shows the 50 most recent entries in the logs. Therefore, it’s possible that the complete logs have a matching pattern but the test returns zero matches.
The filter is now listed on the Subscription filters tab in the log group page on the CloudWatch console.
To verify the solution is working, connect to the RDS instance and run the query for which you created the metric filter.
In the following example, we connect to our MariaDB instance using the MySQL CLI client and run an insert query on the MyLambda table:
We can see the Lambda function is triggered and a message is printed in the logs in the CloudWatch log group. The log group is listed on the CloudWatch console with the naming convention aws/lambda/<lambda-function-name>.

In place of audit logs, you can use any of the other MySQL or MariaDB logs (such as general logs, slow query logs, or error logs) to trigger the Lambda function using the same architecture illustrated in this post.
Note than when using general or slow query logs, you have to set the log_output parameter as FILE from the RDS parameter group for both Amazon RDS for MySQL and Amazon RDS for MariaDB to push the logs to CloudWatch.
The example in this post shows how to trigger a Lambda function and get the payload. You can also use the Lambda function as a router function and trigger other Lambda functions from it-simply pass the name of the function to be triggered as the payload in JSON.
If the Lambda function does not trigger, check the following:
When you’re done with the solution, delete the resources you created to avoid ongoing charges.
In this post, we showed how to deploy a solution to trigger a Lambda function from your RDS for MySQL or MariaDB instance.
Try it out today and leave a comment if you have any questions or suggestions.
 Asad Aazam is a Solutions Architect at AWS with expertise in AWS Security services and AWS Database technologies such as Amazon Aurora, Amazon RDS, and Amazon DynamoDB. He helps homogeneous and heterogeneous database migrations and optimizations in the AWS Cloud. He currently holds 11 of 12 AWS Certificates. When not working, he likes to go on bike rides, travel, and enjoy the beauty of nature.
The post Trigger an AWS Lambda function from Amazon RDS for MySQL or Amazon RDS for MariaDB using audit logs and Amazon CloudWatch appeared first on MariaDB.org.
]]>The post MariaDB Encryption ( data at rest ) appeared first on MariaDB.org.
]]>You have to consider what you want to encrypt . The data communication (data in transit) or the data on the instance (data at rest).
This post is going to focus on the data at rest option using a AWS free tier node running on Amazon Linux. I will be using the world database on 2 different instances to show updating current tables with encryption as well as new loading tables to be auto-encrypted.
1st we will start with installs.. quick and simple just for this demo.
We will load the world db into server_id 100 instance.
Now we can see that currently, both instances are not using encryption.
Now across both systems, I am going to set up Random Keys and encrypt them.
# mkdir /etc/mysql/
Now we can set up the cnf file to enable the plugin as well as options for encryption.
## Temp & Log Encryption
encrypt-tmp-disk-tables = 1
encrypt-tmp-files = 1
encrypt_binlog = ON
Load up the world data into the server_id 200 instance as well.
According to the information_schema.INNODB_TABLESPACES_ENCRYPTION we are encrypted now. However, they do not show that at the schema level. While they say it is encrypted if showing up in the INNODB_TABLESPACES_ENCRYPTION table, I would rather be sure and have it seen in the table and on the schema.
Up to this point, you can see that both instances have been accounted for in the INNODB_TABLESPACES_ENCRYPTION schema after the restart or loading of the schema and data.
So… a few table alters will help here…
This is simple and etc so far.. now we need to enable binlogs and double check more.
Checking via a look at the binlogs….
mariadb-binlog–base64-output=DECODE-ROWS –verbose demo.000001
/*!50530 SET @@SESSION.PSEUDO_SLAVE_MODE=1*/;
/*!40019 SET @@session.max_insert_delayed_threads=0*/;
/*!50003 SET @OLD_COMPLETION_TYPE=@@COMPLETION_TYPE,COMPLETION_TYPE=0*/;
DELIMITER /*!*/;
# at 4
#240225 0:06:06 server id 100 end_log_pos 256 CRC32 0x04ce3741 Start: binlog v 4, server v 10.5.23-MariaDB-log created 240225 0:06:06 at startup
# Warning: this binlog is either in use or was not closed properly.
ROLLBACK/*!*/;
# at 256
# Encryption scheme: 1, key_version: 1, nonce: eb7991b210f3f4d2f7f21537
# The rest of the binlog is encrypted!
ERROR: Error in Log_event::read_log_event(): ‘Event decryption failure’, data_len: 2400465656, event_type: 240
DELIMITER ;
# End of log file
ROLLBACK /* added by mysqlbinlog */;
/*!50003 SET COMPLETION_TYPE=@OLD_COMPLETION_TYPE*/;
/*!50530 SET @@SESSION.PSEUDO_SLAVE_MODE=0*/;
Good to see that it says it is being encrypted now.
I want to see these transactions though in the binlog.. how? You can use mariadb_binlog along with –read-from-remote-server to be able to see the data in the logs…
Hopefully, this can at least help get you started ….
https://mariadb.com/kb/en/securing-mariadb-encryption/
The post MariaDB Encryption ( data at rest ) appeared first on MariaDB.org.
]]>The post Announcing MariaDB Connector/R2DBC 1.2 appeared first on MariaDB.org.
]]>The post Announcing MariaDB Connector/R2DBC 1.2 appeared first on MariaDB.org.
]]>The post MariaDB plc – looking forward to business as usual appeared first on MariaDB.org.
]]>Continue reading “MariaDB plc – looking forward to business as usual”
The post MariaDB plc – looking forward to business as usual appeared first on MariaDB.org.
The post MariaDB plc – looking forward to business as usual appeared first on MariaDB.org.
]]>The post MariaDB Python Connector 1.1.10 now available appeared first on MariaDB.org.
]]>The post MariaDB Python Connector 1.1.10 now available appeared first on MariaDB.org.
]]>The post Post-mortem: PHP and MariaDB Docker issue appeared first on MariaDB.org.
]]>Continue reading “Post-mortem: PHP and MariaDB Docker issue”
The post Post-mortem: PHP and MariaDB Docker issue appeared first on MariaDB.org.
The post Post-mortem: PHP and MariaDB Docker issue appeared first on MariaDB.org.
]]>The post Get Started with MariaDB in Kubernetes and mariadb-operator appeared first on MariaDB.org.
]]>The post Get Started with MariaDB in Kubernetes and mariadb-operator appeared first on MariaDB.org.
]]>The post The benefits of MariaDB ColumnStore appeared first on MariaDB.org.
]]>Since then, I’ve got some questions from customers, colleagues and friends: why did you guys decide to robustly invest into ColumnStore, and offer your ColumnStore services? After all, it’s not a new or trendy technology. So, why ColumnStore and not, for example, the latest NoSQL database?
The main reason is pretty simple: MariaDB ColumnStore can bring huge benefits to our customers. In this article I’m going to elaborate the main advantages of ColumnStore, from both a technical and a strategic perspective.
The first point is about avoiding the introduction of too many technologies in companies that, typically, already use too many technologies.
Just in case you don’t understand what I’m talking about… make a list of the technologies used in your company, or by your team. Include everything that plays a key role: databases, load balancers, caches, object storages, and so on. Each of them should have proper monitoring and alerts, automated backups, an upgrade policy, people able to troubleshoot in depth, inventory/documentation, and more. But the budget is often too low, the team is often too small, and in the end this just doesn’t happen.
ColumnStore is a technology for analytics and data warehouse that runs on top of MariaDB, which is an operational database. Using MariaDB for OLTP and MariaDB ColumnStore for OLAP allows the reuse of people skills. Several tools can be shared: monitoring, ProxySQL, Ansible roles and more. Data pipelines can be greatly improved by using MariaDB replication. The use of the MariaDB CONNECT engine can also simplify ETL processes from other data sources.
MariaDB ColumnStore has a distributed, highly scalable architecture. ColumnStore architecture consists of the following parts:
We can add Performance Nodes to improve a cluster IO capacity, and User Nodes to be able to run more complex queries at the same time.
This architecture allows us to store Petabytes of data (compressed, handled by Performance Nodes), and answer complex queries on billions of rows in seconds (User Nodes).
Even on a single node MariaDB ColumnStore massively scales up taking full advantage of the CPUs.
As ColumnStore name suggests, it is a columnar technology. But this is a simplification. The traditional difference between row-based and columnar architectures is that the latter typically stores each table column in a different file, to allow fast aggregations and better compression. But, in order to scale better on each node, ColumnStore has a more complex storage design, in order to store big amounts of data while making sorting and grouping fast and reducing contention.
Column data is split into partitions, that is, logical blocks that contain a range of values. Partitions are stored in big units called extents. Typically, each file contains up to two extents from the same column. There are no indexes; instead, an extent map indicates the location of each partition and the lowest value it contains.
ColumnStore has a pool of threads that remain running even when not in use. When PrimProc receives a request, it will split the job into multiple parts and each thread will run one of these parts, in parallel. So jobs are split not just over multiple nodes, but even over multiple threads within each node.
If an S3-compatible service is used as main storage, all Performance Nodes have access to it, but a local cache exists on a shared storage device.
Whether S3 is used or not, a shared device allows high availability. Each node has a corresponding directory in the shared storage, but each directory is mounted on all nodes.
MariaDB ColumnStore is designed for intensive reads with occasional huge data updates, which is typical of OLAP databases. So the locking system is minimal, and designed to serve this type of usage without reducing scalability. So reads are not locking, and no operation blocks them (not even ALTER TABLEs). Writes acquire locks on whole tables, rather than locking every modified row.
Let me stress this again:
This is the result of MCS super scalable architecture illustrated above.
Each MariaDB node sees ColumnStore as a regular storage engine. All it knows is that when data needs to be written into a ColumnStore table or read from it, MariaDB needs to call the proper methods of the ColumnStore storage engine API.
As a result, almost all MariaDB SQL syntaxes work on ColumnStore tables. There are some exceptions, but they’re not very relevant.
More importantly, an SQL statement can involve ColumStore tables and tables built with any other engine. This opens up new scenarios that would be impossible if you use different technologies for OLTP and for analytics. Some examples:
INSERT SELECT statement from a cron job, skip the most complex parts of ETL processes.For the reasons explained above, technologies that integrate with MariaDB will also work with ColumnStore. Some relevant examples for data analysis professionals are:
ColumnStore (as part of the MariaDB community edition) is distributed under the terms of the GNU GPL, version 2. There are no license costs.
MariaDB ColumnStore, community edition, won’t bind you to any particular vendor:
MariaDB ColumnStore is an outstanding solution for analytics. This is because of its peculiar features built to scale OLAP workloads, and because it’s based on MariaDB, one of the most widely used DBMSs for OLTP. And it’s open source, and free.
To begin with, you can read our unofficial documentation and try ColumnStore as a single node on your laptop with our Vagrant or Docker image.
Do you need help to evaluate ColumnStore for your specific use case? Do you need help to deploy and configure it? Do you need help with data integration? Or maybe a training for your data analysts? Contact us to discuss your needs!
Federico Razzoli
The post The benefits of MariaDB ColumnStore appeared first on MariaDB.org.
]]>The post Announcing General Availability of MariaDB Connector/C++1.1 appeared first on MariaDB.org.
]]>The post Announcing General Availability of MariaDB Connector/C++1.1 appeared first on MariaDB.org.
]]>The post MariaDB Java Connector 3.3.3 and 2.7.12 now available appeared first on MariaDB.org.
]]>The post MariaDB Java Connector 3.3.3 and 2.7.12 now available appeared first on MariaDB.org.
]]>The post Release Roundup February 21, 2024 appeared first on MariaDB.org.
]]>The post Release Roundup February 21, 2024 appeared first on MariaDB.org.
]]>The post MariaDB 11.4.1, 11.3.2 now available appeared first on MariaDB.org.
]]>Continue reading “MariaDB 11.4.1, 11.3.2 now available”
The post MariaDB 11.4.1, 11.3.2 now available appeared first on MariaDB.org.
The post MariaDB 11.4.1, 11.3.2 now available appeared first on MariaDB.org.
]]>The post Codership shines with other EIC-funded companies at Mobile World Congress Barcelona 2024 appeared first on MariaDB.org.
]]>Join us at EIC Pavilion-4YFN-booth 8.1A20
The post Codership shines with other EIC-funded companies at Mobile World Congress Barcelona 2024 appeared first on MariaDB.org.
]]>The post Perf regressions in Postgres from 9.0 to 16 with sysbench and a small server appeared first on MariaDB.org.
]]>My results here aren’t universal, but you have to start somewhere:
The configuration files are in the subdirectories named pg9, pg10, pg11, pg12, pg13, pg14, pg15 and pg16 from here. They are named conf.diff.cx9a2_bee.
The benchmark is run with:


The post Perf regressions in Postgres from 9.0 to 16 with sysbench and a small server appeared first on MariaDB.org.
]]>The post Optimizing PostgreSQL Performance: A Comprehensive Guide to Rowstore Index Implementation and Tuning appeared first on MariaDB.org.
]]>fillfactor, which defines how full index pages should be before splitting. A lower fillfactor on a heavily updated table can reduce page splits, improving performance.ANALYZE and VACUUM commands helps keep indexes efficient by updating statistics and reclaiming space from deleted rows. This is crucial for maintaining query performance over time.pg_stat_user_indexes and pg_stat_statements to monitor index usage and query performance. Over time, query patterns may change, and some indexes may become unnecessary or suboptimal, requiring adjustments.By carefully implementing and tuning rowstore indexes according to these guidelines, you can significantly enhance the performance of your PostgreSQL database.
The post Optimizing PostgreSQL Performance: A Comprehensive Guide to Rowstore Index Implementation and Tuning appeared first on The WebScale Database Infrastructure Operations Experts in PostgreSQL, MySQL, MariaDB and ClickHouse.
The post Optimizing PostgreSQL Performance: A Comprehensive Guide to Rowstore Index Implementation and Tuning appeared first on MariaDB.org.
]]>The post Optimizing SQL Server Performance: Implementing RowStore vs. ColumnStore Indexes appeared first on MariaDB.org.
]]>RowStore indexes are the traditional way of storing data in SQL Server, where data is stored in rows within pages. Each page can contain multiple rows, depending on the size of the rows and the page size (8KB).
Implementation and Example:
CREATE TABLE Employees (
  EmployeeID INT PRIMARY KEY,
  Name NVARCHAR(100),
  DepartmentID INT
);

-- Creating a clustered index
CREATE CLUSTERED INDEX IX_Employees ON Employees(DepartmentID);
-- Creating a non-clustered index
CREATE NONCLUSTERED INDEX IX_Employees_Name ON Employees(Name);
Performance Considerations:
Introduced in SQL Server 2012, ColumnStore indexes store data column-wise, meaning each column’s data is stored together, allowing for high compression rates and fast query performance on large datasets.
Implementation and Example:
-- Creating a clustered columnstore index
CREATE CLUSTERED COLUMNSTORE INDEX CCI_Employees ON Employees;
-- Creating a non-clustered columnstore index
CREATE NONCLUSTERED COLUMNSTORE INDEX NCCI_Employees_Name ON Employees(Name);
Performance Considerations:
By strategically implementing RowStore and ColumnStore indexes based on the specific needs of your workload, you can optimize SQL Server’s performance, enhancing both the efficiency and speed of data retrieval and analysis.
The post Optimizing SQL Server Performance: Implementing RowStore vs. ColumnStore Indexes appeared first on The WebScale Database Infrastructure Operations Experts in PostgreSQL, MySQL, MariaDB and ClickHouse.
The post Optimizing SQL Server Performance: Implementing RowStore vs. ColumnStore Indexes appeared first on MariaDB.org.
]]>The post Percona Monthly Bug Report: January 2024 appeared first on MariaDB.org.
]]>The post Percona Monthly Bug Report: January 2024 appeared first on MariaDB.org.
]]>The post How to implement Parallel Redo Logging in InnoDB? appeared first on MariaDB.org.
]]>Here are generalized steps and considerations for optimizing redo log performance in InnoDB, which can indirectly influence how redo operations are executed:
innodb_log_file_size configuration to a larger size to reduce the frequency of redo log flushes, but ensure it’s balanced with recovery time considerations.innodb_flush_log_at_trx_commit parameter controls the balance between ACID compliance and performance. Setting it to 2 can improve write performance by reducing disk flush operations but at a slight risk to data durability.innodb_log_files_in_group). While this doesn’t parallelize the logging within a single transaction, it can optimize I/O operations across transactions.innodb_io_capacity and innodb_write_io_threads to align with your hardware’s capabilities.While InnoDB does not offer a direct setting named “parallel redo logging,” the combination of configuration optimizations, adequate hardware, and MySQL version updates can collectively enhance the efficiency of redo log operations. These improvements can lead to better overall performance, especially for write-intensive applications. Always test configuration changes in a development environment before applying them to production to understand their impact on your specific workload.
The post How to implement Parallel Redo Logging in InnoDB? appeared first on The WebScale Database Infrastructure Operations Experts in PostgreSQL, MySQL, MariaDB and ClickHouse.
The post How to implement Parallel Redo Logging in InnoDB? appeared first on MariaDB.org.
]]>The post Perf regressions in MySQL from 5.6.21 to 8.0.36 using sysbench and a small server appeared first on MariaDB.org.
]]>My results here aren’t universal.
tl;dr
The benchmark is run with one connection and a database cached by InnoDB.
From 5.6.21 to 8.0.36
This section uses 5.6.21 as the base version and then compares that with 5.6.51, 5.7.10, 5.7.44, 8.0.13, 8.0.14, 8.0.20, 8.0.28, 8.0.35 and 8.0.36 to show how performance has changed from oldest tested (5.6.21) to newest tested (8.0.36).


The post Perf regressions in MySQL from 5.6.21 to 8.0.36 using sysbench and a small server appeared first on MariaDB.org.
]]>The post Announcing MariaDB Community Server 11.3 GA and 11.4 RC appeared first on MariaDB.org.
]]>The post Announcing MariaDB Community Server 11.3 GA and 11.4 RC appeared first on MariaDB.org.
]]>The post Installing Galera Cluster 4 with MySQL on Ubuntu 22.04 appeared first on MariaDB.org.
]]>First, you will need to ensure that the Galera Cluster GPG key is installed:
apt-key adv --keyserver keyserver.ubuntu.com --recv 8DA84635
You will see the message as follows:
Warning: apt-key is deprecated. Manage keyring files in trusted.gpg.d instead (see apt-key(8)).
Executing: /tmp/apt-key-gpghome.pEjdHcaXNs/gpg.1.sh --keyserver keyserver.ubuntu.com --recv 8DA84635
gpg: key 45460A518DA84635: public key "Codership Oy (Codership Signing Key) <info@galeracluster.com>" imported
gpg: Total number processed: 1
gpg:               imported: 1
You can now edit the /etc/apt/sources.list.d/galera.list to include the following lines:
deb https://releases.galeracluster.com/galera-4.17/ubuntu jammy main
deb https://releases.galeracluster.com/mysql-wsrep-8.0.35-26.16/ubuntu jammy main
You should also pin the repository by editing /etc/apt/preferences.d/galera.pref:
# Prefer the Codership repository
Package: *
Pin: origin releases.galeracluster.com
Pin-Priority: 1001
You should now run an apt update and then install Galera 4 with MySQL 8:
apt install galera-4 mysql-wsrep-8.0
You are now told to enter a root password as apt/dpkg supports interactivity during installations. Please enter a reasonably secure password. Then you are asked if you should use a strong password, which is caching_sha2_password (you are encouraged to pick this, compared to the older mysql_native_password).
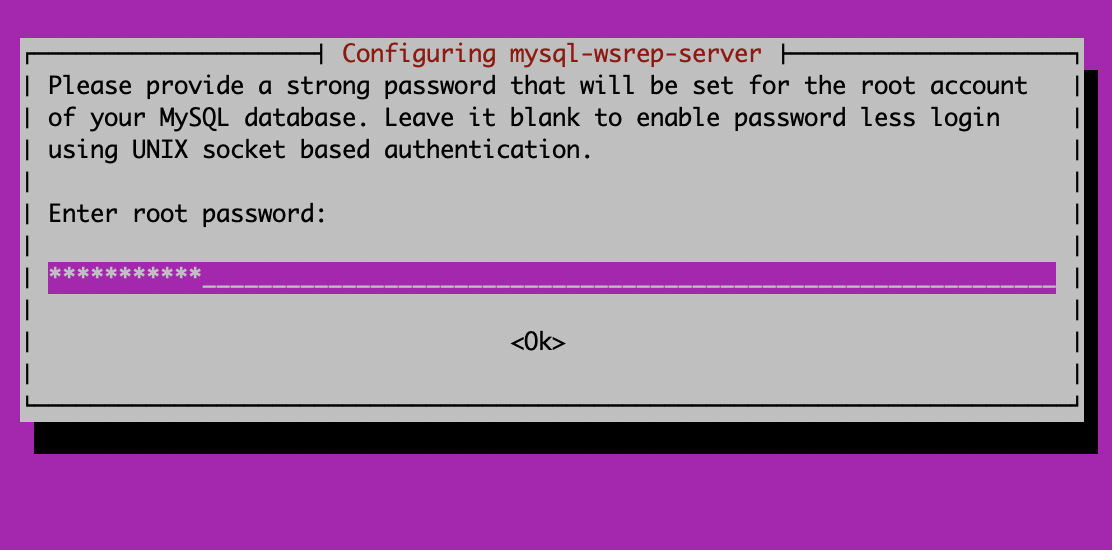
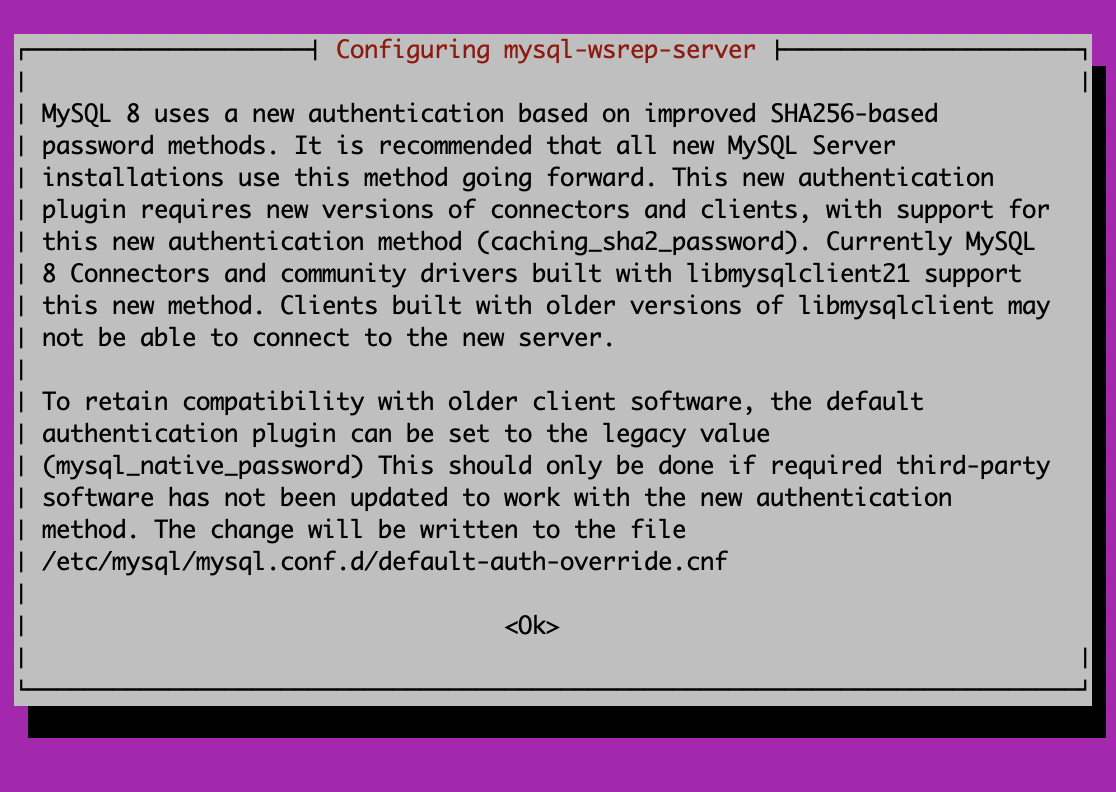
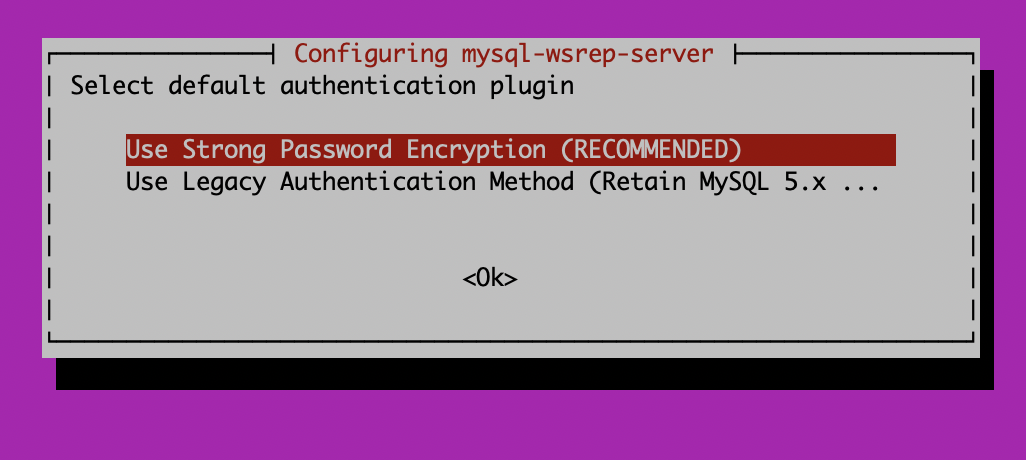
Now it is as simple as configuring your my.cnf to enable Galera Cluster. You can edit /etc/mysql/mysql.conf.d/mysqld.cnfand add a basic configuration:
[mysqld]
pid-file        = /var/run/mysqld/mysqld.pid
socket          = /var/run/mysqld/mysqld.sock
datadir         = /var/lib/mysql
log-error       = /var/log/mysql/error.log

binlog_format=ROW
default-storage-engine=innodb
innodb_autoinc_lock_mode=2
bind-address=0.0.0.0

# Galera Provider Configuration
wsrep_on=ON
wsrep_provider=/usr/lib/galera/libgalera_smm.so

# Galera Cluster Configuration
wsrep_cluster_name="galera"
wsrep_cluster_address="gcomm://128.199.161.224,188.166.183.120,188.166.242.246"

# Galera Synchronization Configuration
wsrep_sst_method=rsync

# Galera Node Configuration
wsrep_node_address="128.199.161.224"
Execute systemctl stop mysql. Run mysqld_bootstrap only on the first node.
You can execute: mysql -u root -p -e "show status like 'wsrep_cluster_size'" and see:
mysql -u root -p -e "show status like 'wsrep_cluster_size'"
Enter password:
+--------------------+-------+
| Variable_name      | Value |
+--------------------+-------+
| wsrep_cluster_size | 1     |
+--------------------+-------+
Now, when you bring up the second node as simply as systemctl start mysql, you can execute the same command above and will see that the wsrep_cluster_size has increased to 2. Repeat this again for the third node. You can also choose to test replication by creating a database and table on one node, and see that the replication is happening in real time.
To find out more, start MySQL and execute show status like 'wsrep%';.
Remember that you did not have to look for passwords in the error log because this was already executed via the interactive installer. Enjoy your deployment of a 3-node Ubuntu 22.04 LTS Galera Cluster.
The post Installing Galera Cluster 4 with MySQL on Ubuntu 22.04 appeared first on MariaDB.org.
]]>The post Let’s go, MariaDB ColumnStore at Vettabase! appeared first on MariaDB.org.
]]>Having a columnar based engine built right into MariaDB, aptly named ColumnStore, means there is no excuse for you to not give it a whirl where you probably already have a MariaDB replica server for OLAP workloads like reporting, archiving, or data warehousing.
So for the new year I thought, what better way to share my love of ColumnStore than to host a webinar just before the Spring?
While I personally run ColumnStore on my trusty server in the garage, I needed to create a portable environment using Docker in a repository for people attending to follow along with. Pretty standard so far.
Alas to my surprise, the official ColumnStore image is out of date, built manually, and actually does not work as the required processes are being run by a tool that has since been migrated to use systemd. And there is no official Vagrant image. See MCOL-5646 and MCOL-3906.
I guess we should just make our own ColumnStore images for Docker and Vagrant then!
And so the ColumnStore adventure begins here at Vettabase.
Another issue we quickly encountered was the lack of documentation. MariaDB has great documentation, the MariaDB Knowledge Base, and it used to include ColumnStore documentation. It is a wiki that anyone can edit, and the contents are covered by the GNU FDL and CC-BY-SA3 licenses. Unfortunately all ColumnStore documentation was removed and only a small part of it migrated to MariaDB Enterprise documentation. See MCOL-5655.
So we decided to start the MariaDB ColumnStore Unofficial Documentation Project! It is a public wiki that the community can edit, and the contents are covered by the same licenses as the original documentation. See our manifesto.
At the time of this writing registration is broken due to a problem with Amazon SES. We are working to fix it. In the meanwhile, feel free to ask us to give you access by writing an email to co**************@ve*******.com.
So what does this mean going forward? Should yee abandon all hope for those who dare adventure outside of our new realm? No, of course not.
While we are working on a solution for customers and the community to run and understand ColumnStore, you can help by voting on existing issues to bring the official docker image up to date and have ColumnStore enabled in the community image:
While our own OCI image, at the time of writing, is still facing some issues, we are making progress:
MariaDB [(none)]> create schema test; create table test.t (a int) engine=columnstore;
Query OK, 1 row affected (0.001 sec)

Query OK, 0 rows affected (0.300 sec)

MariaDB [(none)]> insert into test.t () values (1);
Query OK, 1 row affected (0.059 sec)
The current state is:
dev.latest tag, you will know that the image is fairly stable.So for both our container and Vagrant efforts please do raise an issue or submit a pull request.
ColumnStore is a great engine, which I will be demonstrating in my first and next webinar at Vettabase, it really does deserve some love.
Do you have any ColumnStore success stories? We would love to hear them.
vettadock/mariadb-columnstore)
vettabase/mariadb-columnstore)
Richard Bensley
The post Let’s go, MariaDB ColumnStore at Vettabase! appeared first on MariaDB.org.
]]>The post Webinar: Mastering Galera Cluster, Best Practices and New Features 27th February appeared first on MariaDB.org.
]]>What You Will Learn:
* Core Best Practices: Dive into essential practices, from employing primary keys and leveraging InnoDB to deciding if to optimise read/write splits and managing AUTO_INCREMENT settings.
* Advanced Configuration: Uncover advanced techniques for error monitoring, configuring Galera across networks, and fine-tuning the gcache for optimal performance.
* Innovative Features: Stay ahead with insights on implementing Non-Blocking Operations for seamless schema changes, coordinating distributed transactions with XA transactions, and securing your GCache through encryption.
* Protocol and Network Enhancements: Discover the latest advancements in handling unstable networks, protocol improvements, and explore new options to elevate your cluster operations.
Have in-depth questions or faced intricate production challenges? This extended Q&A session is your opportunity to seek advice, clarify doubts, and engage directly with Galera Cluster experts.
JOIN EMEA WEBINAR 27th FEBRUARY 13 PM CET
JOIN USA WEBINAR 27th FEBRUARY 9 AM PST
Do not forget Galera Cluster Advanced Database Administration with Galera Cluster training Emea 4th-5th of March and USA 6th-7th of March.
Check training content and join 2 days training
The post Webinar: Mastering Galera Cluster, Best Practices and New Features 27th February appeared first on MariaDB.org.
]]>The post It wasn’t a performance regression in Postgres 14 appeared first on MariaDB.org.
]]>The reason for the false alarm is that index cleanup was skipped during vacuum starting with Postgres 14 and the impact is that the optimizer had more work to do (more not-visible index entries to skip) in the get_actual_variable_range function. Output like this from the vacuum command makes that obvious:
table “pi1”: index scan bypassed: 48976 pages from table (0.62% of total) have 5000000 dead item identifiers
The problem is solved by adding INDEX_CLEANUP ON to the vacuum command.
tl;dr
Editorial
At a high-level there are several issues:
Third, the Postgres optimizer can use too much CPU time in get_actual_variable_range. I don’t mind that get_actual_variable_range exists because it is useful for cases where index statistics are not current. But the problem is that for the problematic SQL statement (see the DELETE above and this blog post) there is only one good index for the statement. So I prefer the optimizer not do too much work in that case. I have experienced this problem a few times with MySQL. One of the fixes from upstream MySQL was to change the optimizer to do less work when there was a FORCE INDEX hint. And with some OLTP workloads where the same statements are so frequent I really don’t want the optimizer to use extra CPU time. For the same reason, I get much better throughput from Postgres when prepared statements are enabled and now I always enable them for the range and point queries with Postgres during the insert benchmark, but not for MySQL (because they don’t help much with MySQL).
Build + Configuration
The post It wasn’t a performance regression in Postgres 14 appeared first on MariaDB.org.
]]>The post Tips and Tricks for reducing Leaf Block Contention happening to InnoDB appeared first on MariaDB.org.
]]>innodb_page_size configuration. The default page size is 16KB, but if your workload involves large rows or if you’re experiencing high contention, increasing the page size can reduce the number of row locks within the same leaf block. However, be cautious as this change requires recreating the database and can affect disk usage and memory utilization.LOW_PRIORITY write operations for less critical updates to decrease their priority and reduce contention.innodb_autoinc_lock_mode. Setting it to 2(interleaved) mode reduces contention on auto-increment locks by allowing statements to get the next auto-increment value without waiting for other statements to complete, suitable for high concurrency INSERT operations.READ COMMITTED instead of REPEATABLE READ can decrease the number of locks set by a transaction, reducing contention. However, ensure that this change is compatible with your application’s consistency requirements.SHOW ENGINE INNODB STATUS and performance schema tables can help identify contention points.INFORMATION_SCHEMA.INNODB_TRX and INNODB_LOCKS tables to analyze locking behavior and identify contentious queries.DYNAMIC and COMPRESSED can store more data on a page, reducing the need for accessing multiple leaf blocks for queries. This change, however, should be tested as it might have implications on CPU usage due to compression.Reducing leaf block contention in InnoDB requires a combination of database configuration adjustments, query optimization, and strategic schema design. By implementing these tips and continuously monitoring your database’s performance, you can significantly mitigate the impact of contention on your database’s throughput and response times.
The post Tips and Tricks for reducing Leaf Block Contention happening to InnoDB appeared first on The WebScale Database Infrastructure Operations Experts in PostgreSQL, MySQL, MariaDB and ClickHouse.
The post Tips and Tricks for reducing Leaf Block Contention happening to InnoDB appeared first on MariaDB.org.
]]>The post Considering Alternatives for Your MySQL Migration? Why Percona Should Be Your First Choice appeared first on MariaDB.org.
]]> You know about MySQL; we know about MySQL. After all, it’s been the most popular database system for years now. And now that we have that out of the way, on to the more important stuff!Because MySQL is so popular, you might be considering migrating your database to MySQL Community Edition or MySQL Enterprise. If […]
The post Considering Alternatives for Your MySQL Migration? Why Percona Should Be Your First Choice appeared first on MariaDB.org.
]]>